
2022 Gartner® Magic Quadrant™ SIEM
Get the report
MoreTrusted by thousands of customers globally.
Browse our library of ebooks, briefs, reports, case studies, webinars & more.
Deep AWS integrations and out-of-the-box content for unified visibility of AWS services and lightning-fast troubleshooting.
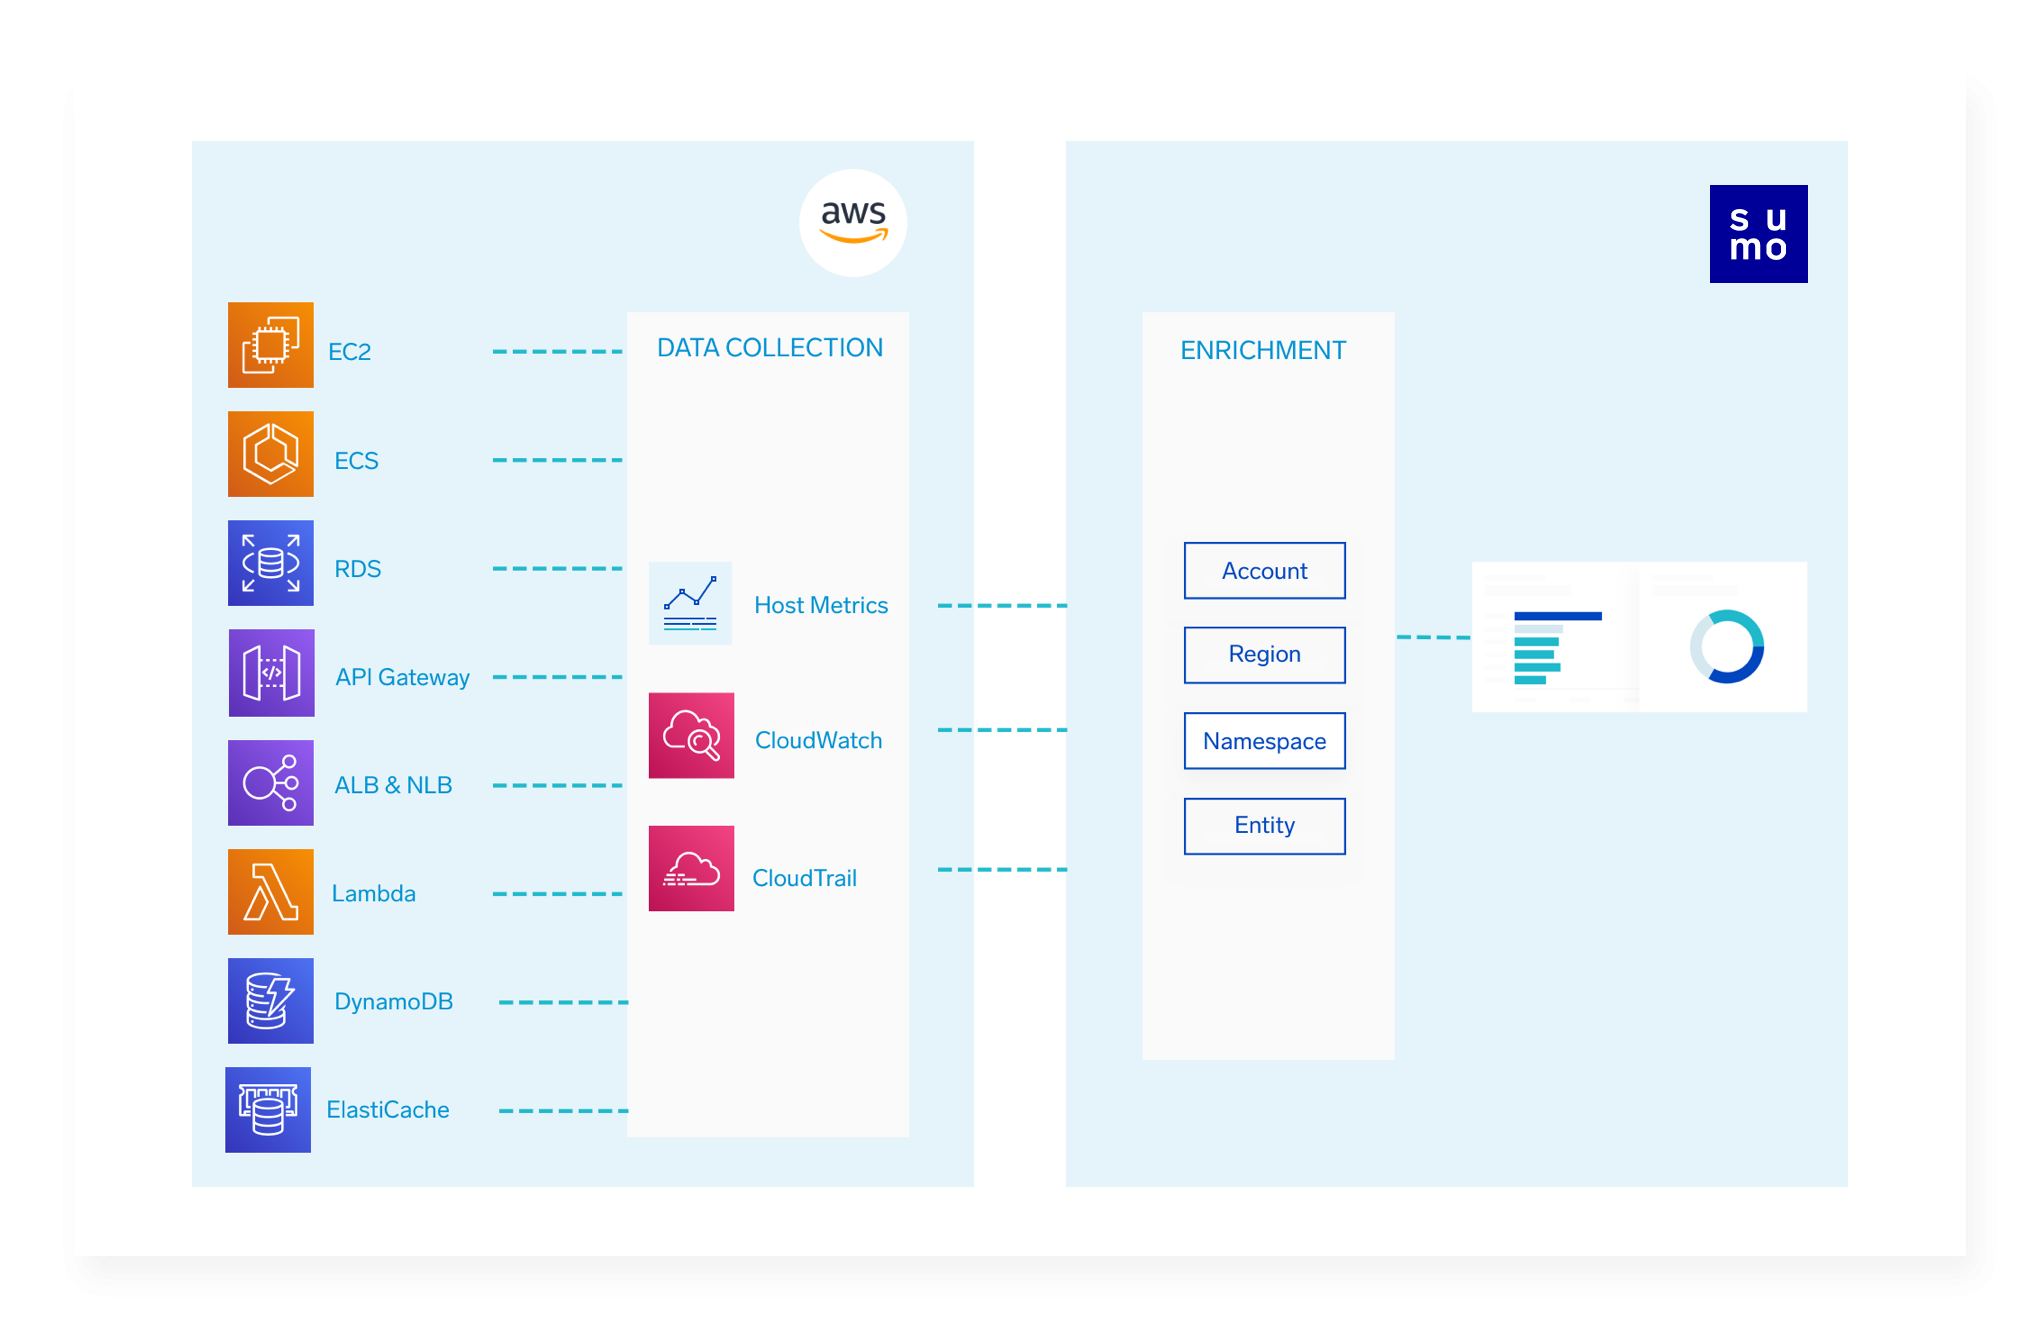
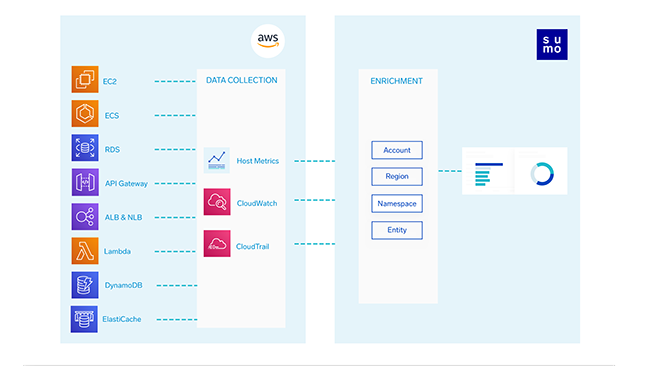
Unify visibility across key Amazon Web Services (AWS), such as EC2, ECS, RDS, ElastiCache, API Gateway, Lambda, DynamoDB, Application ELB and Network ELB.
“Sumo Logic’s AWS Observability solution is providing the real-time insights and intelligence across our platform to operate at speed and scale, while protecting our customer data.”
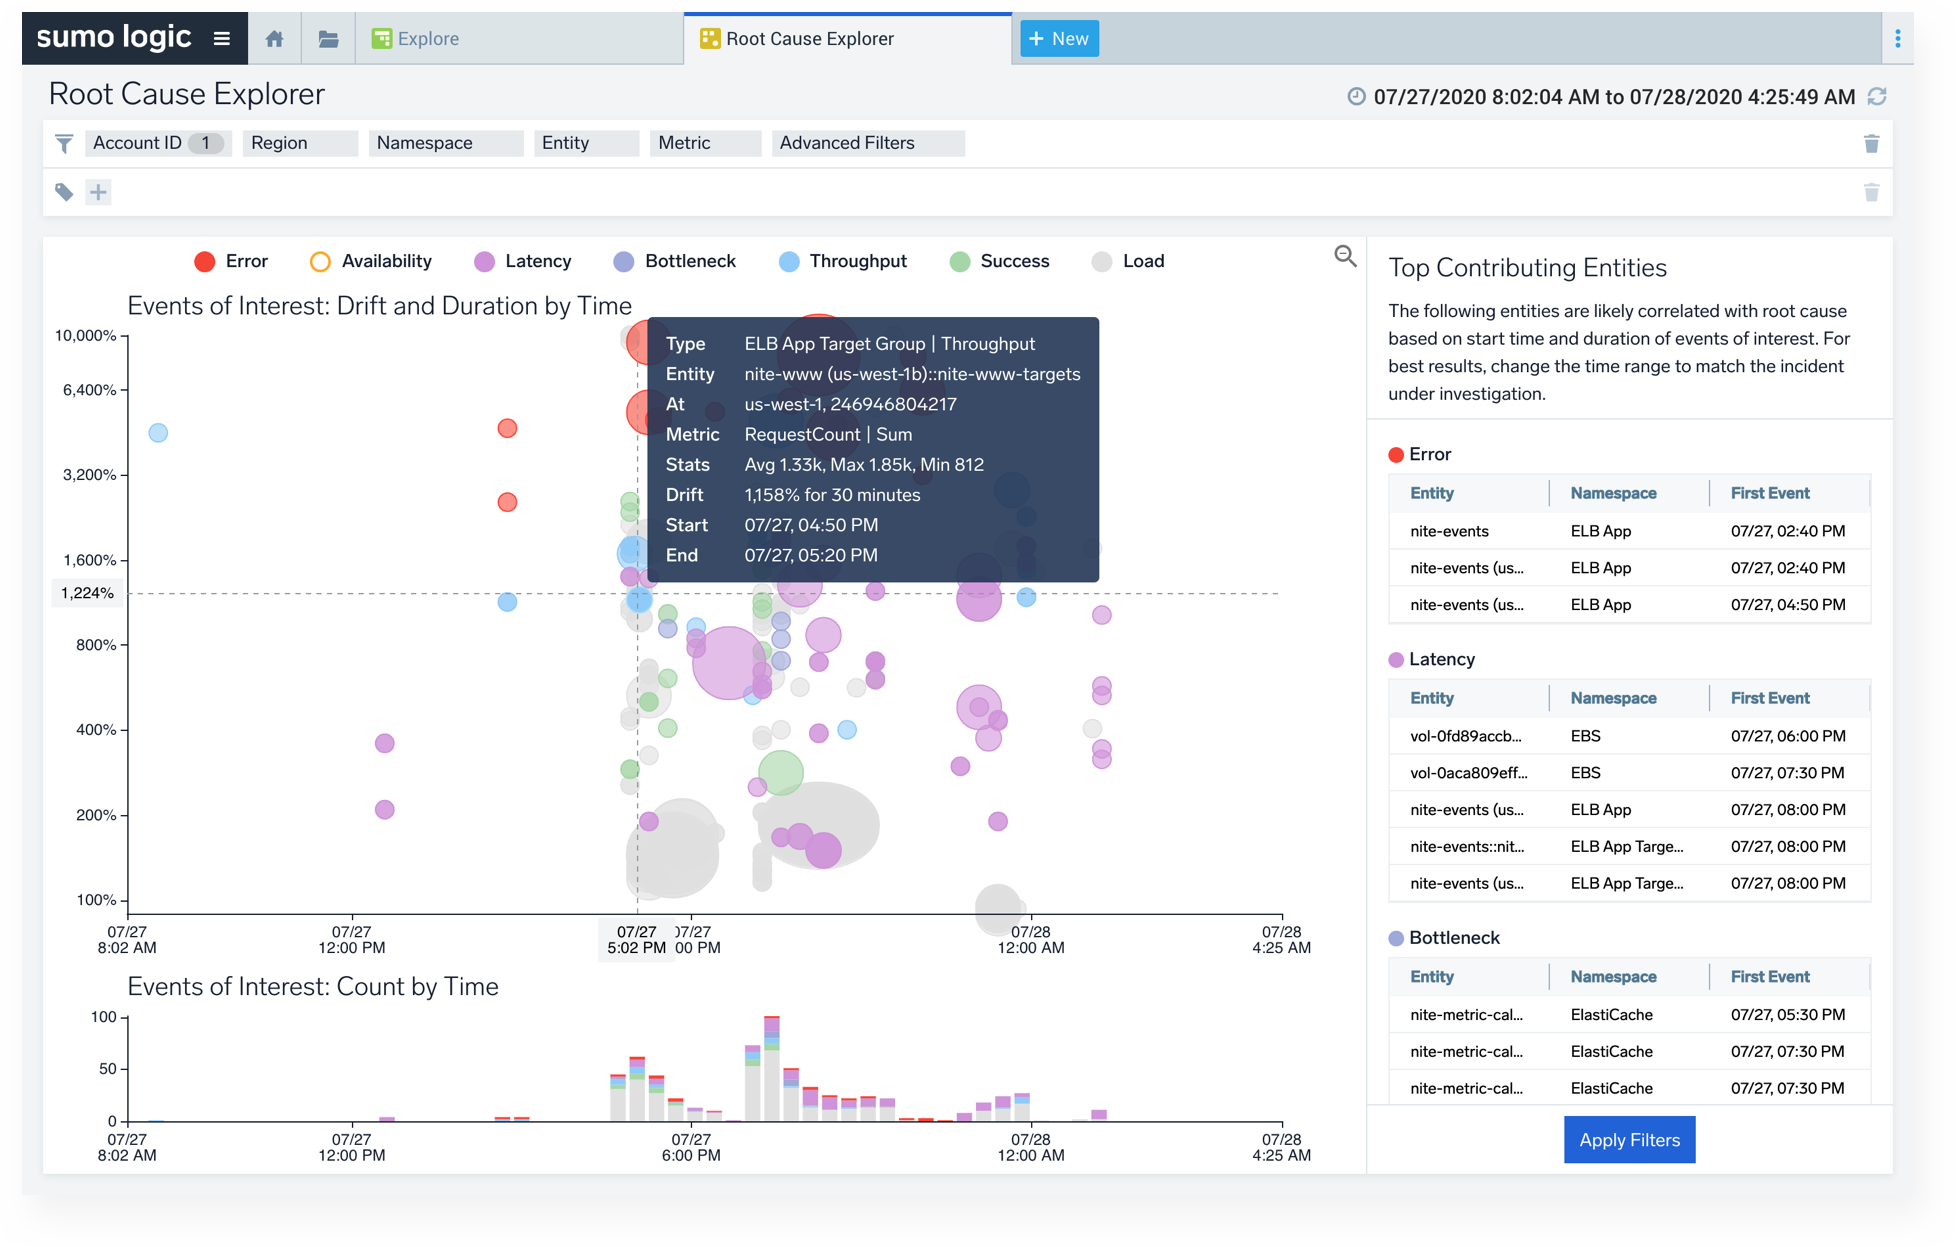
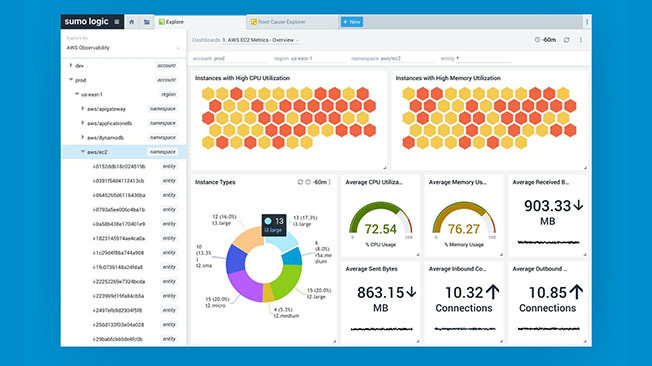
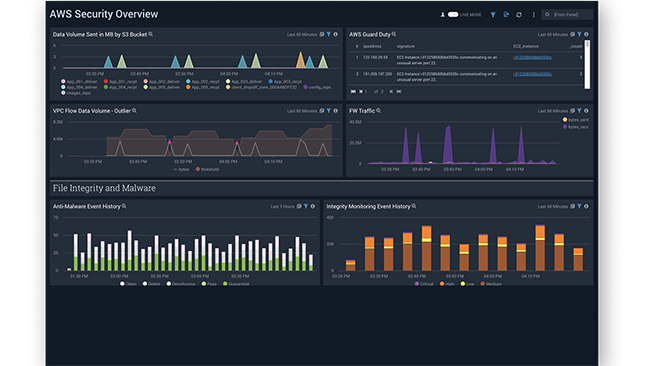
Visualizations of anomalous events of interest across multiple AWS infrastructure services help DevOps teams quickly identify the root cause of performance issues and application incidents. Sumo Logic’s Root Cause Explorer monitors AWS cloud resources to automate anomaly detection, establishing an activity baseline and surfacing high deviation events.
Using AWS CloudFormation or Terraform, get data flowing into Sumo Logic’s monitoring solution in just minutes. Sumo Logic tags data with the AWS account, region, namespace and availability zone to provide context and enables users to pivot between critical log and custom metric data.
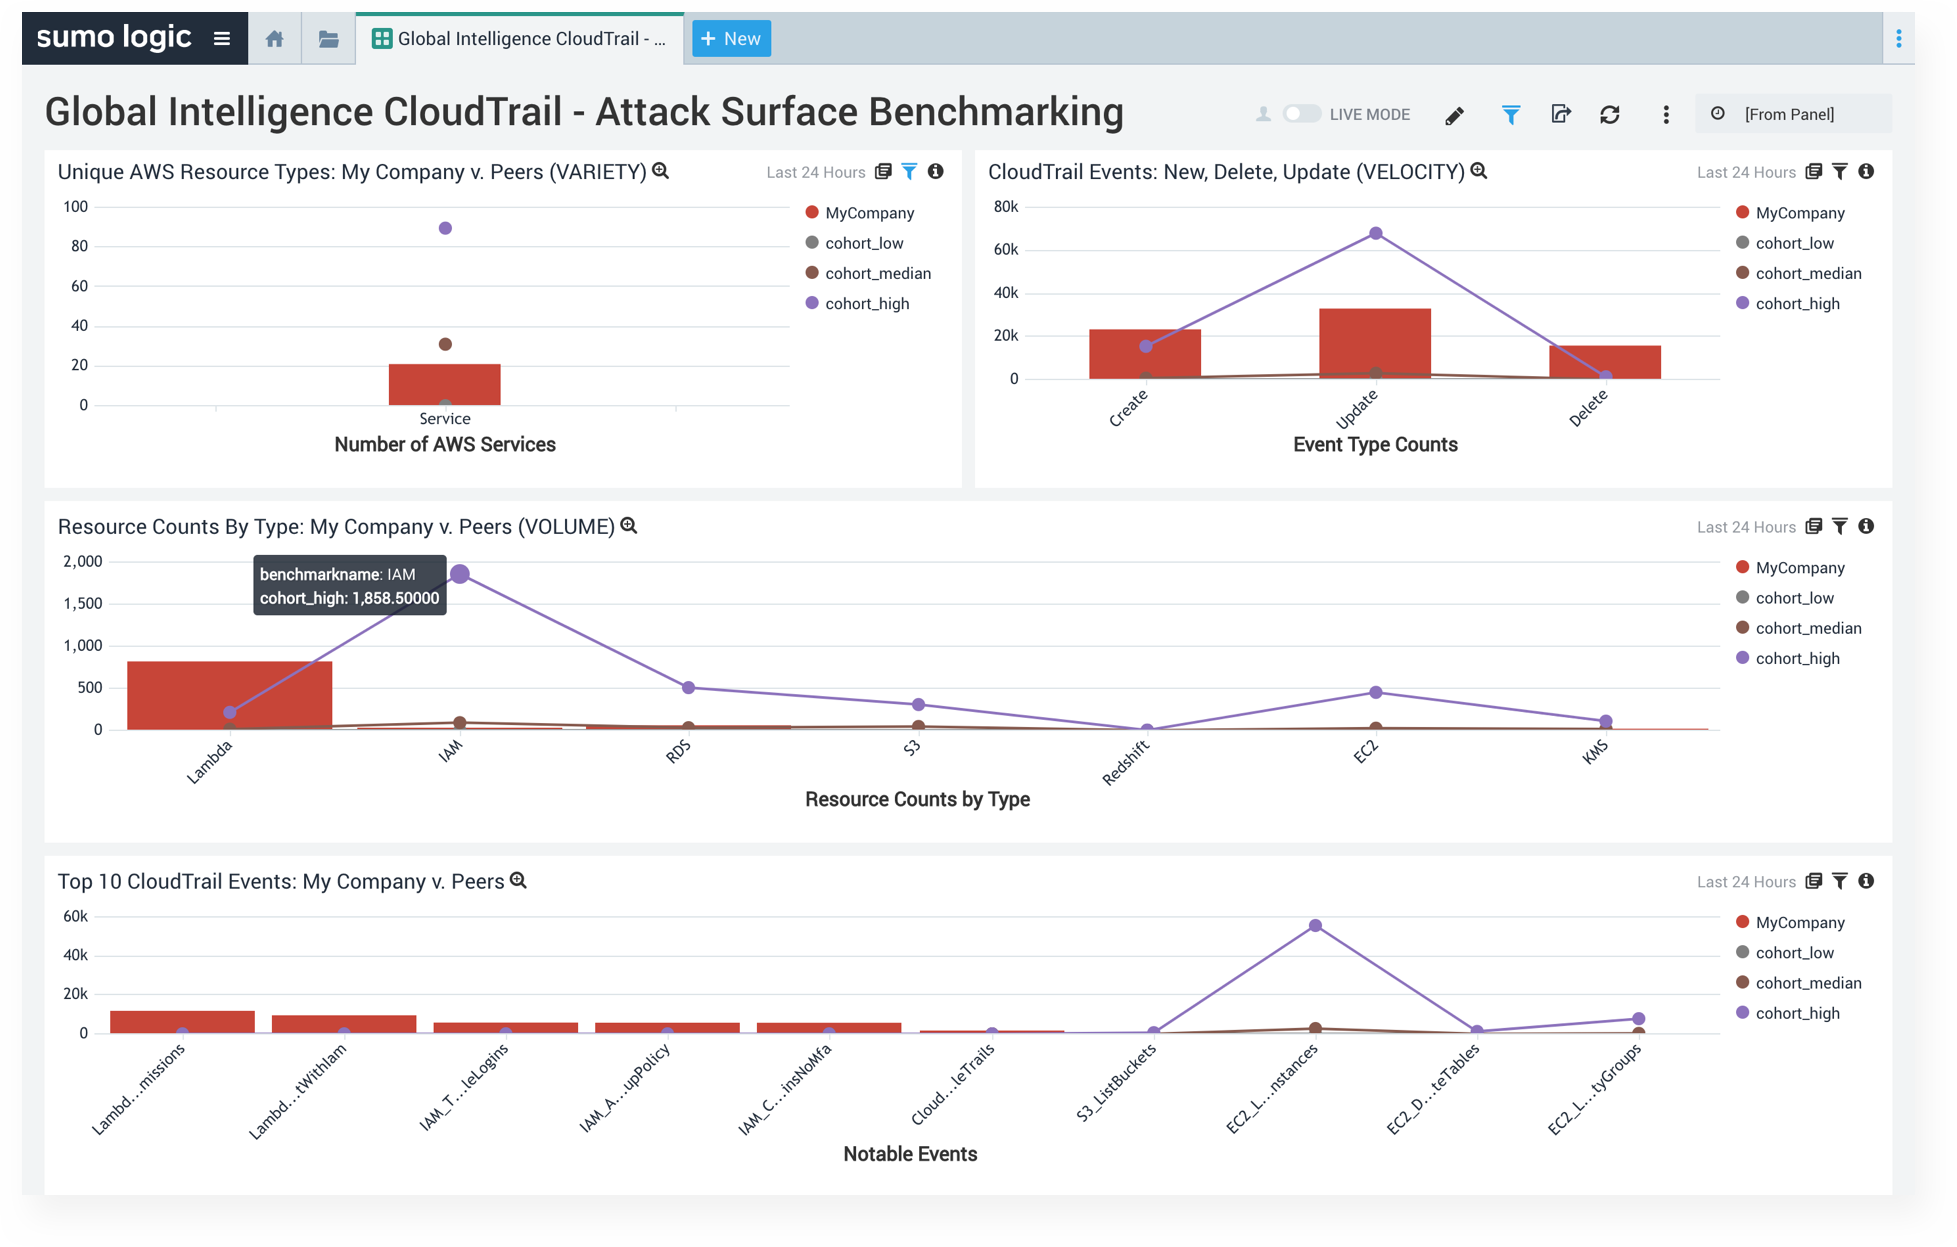
With the Global Intelligence Service for AWS CloudTrail, enterprises can also benchmark the behavior or their usage of AWS services against AWS peer user groups. For example, detect misconfigurations and security exposure of your cloud infrastructure.
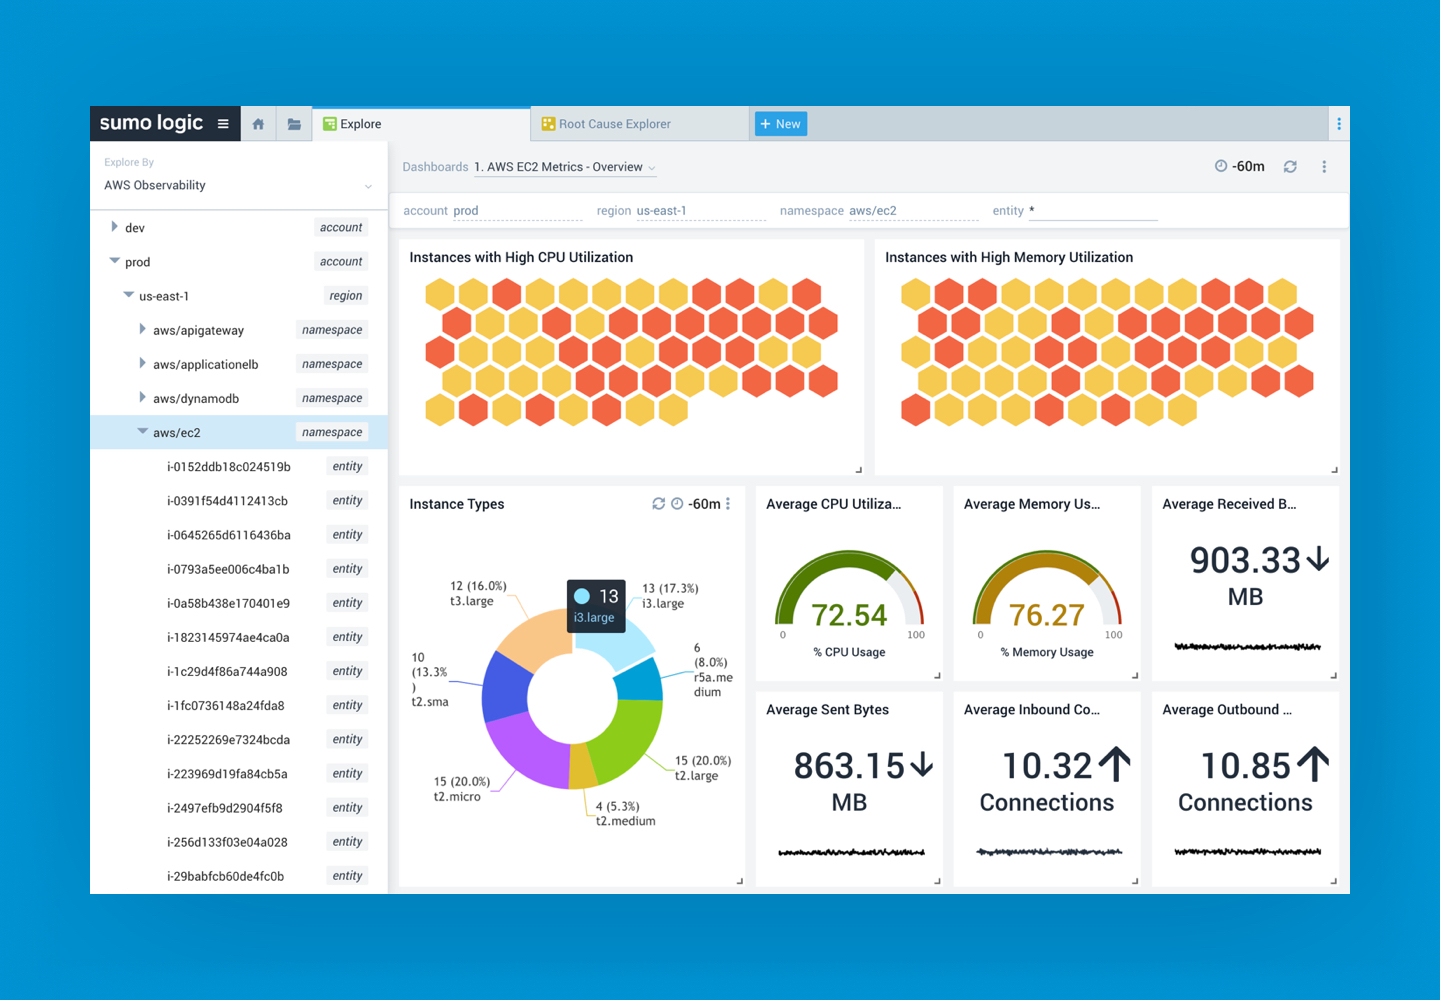
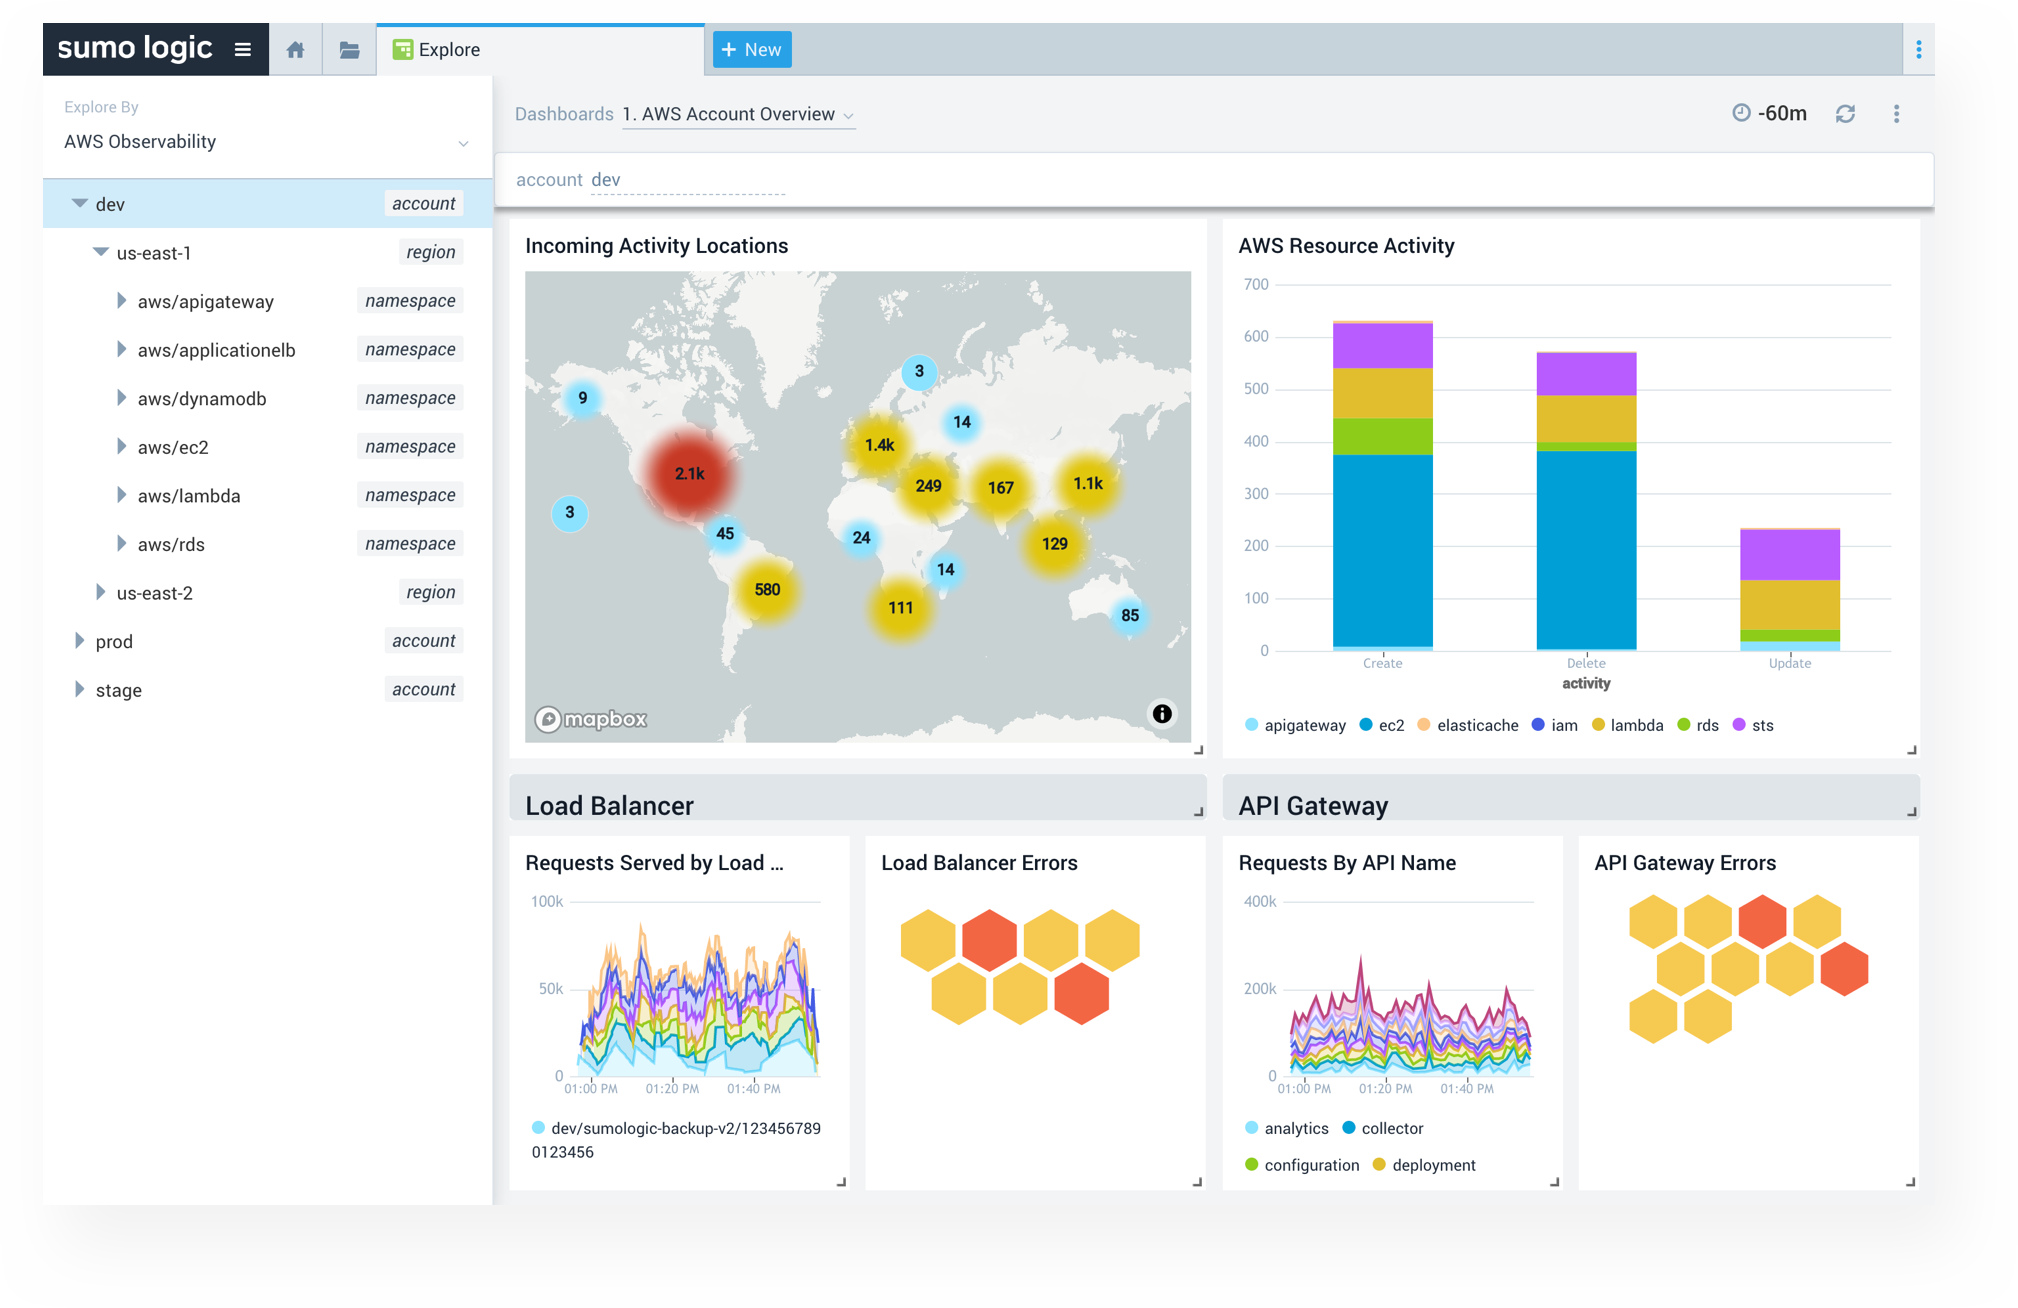
To keep operations running smoothly, organizations need quick access to insights from their AWS services, such as clarity on whether an application issue is affecting instances in certain regions or availability zones.
Sumo Logic's single pane of glass offers unified visibility across AWS services, regions and accounts. Root Cause Explorer lets teams visualize anomalous events of interest across multiple AWS services to quickly identify the root cause of application incidents. These capabilities help organizations maximize uptime and accelerate incident resolution.
As a cloud-native SaaS solution, Sumo Logic made a strategic bet to go all in with AWS early in our company’s history. In 2021, Sumo Logic was named AWS’s ISV Partner of the Year, in recognition of our decade-long commitment to helping customers drive innovation on AWS. Our solution helps organizations accelerate their AWS migrations and confidently monitor, diagnose, and troubleshoot their AWS cloud infrastructure. You can learn more about our customers’ success stories here.
Sumo Logic’s AWS Observability solution supports the following AWS resources and services: Amazon Elastic Compute Cloud (Amazon EC2), Amazon Elastic Container Service (ECS), Relational Database Service (RDS), ElastiCache, API Gateway, Lambda, DynamoDB, Application Elastic Load Balancer (ELB), and Network ELB.
Amazon CloudWatch provides AWS monitoring tools. Sumo Logic can bring in CloudWatch metrics and logs data for more effective analysis, offering you simplified search, advanced analytical functions, and customizable dashboards. Review this blog post for more information on how we can ingest your AWS CloudWatch data and to learn about various factors, including our pricing model, that make us unique.
There are many discussions in the DevOps world about the difference between monitoring and observability. Monitoring, by definition, is the process of collecting, analyzing and using data to track various systems. Whereas, observability leverages all of the data from logs, metrics and traces to help development teams detect and resolve any issues. Observability focuses on understanding the context of all of the metrics and internal state of your infrastructure.
In simple terms, monitoring is capturing and displaying data, and observability is understanding system health through inputs and outputs.
Sumo Logic's log aggregation capabilities and machine learning and pattern detection give enterprises visibility into AWS deployments, manage application monitoring and performance, maintain the security of cloud environments and comply with internal and external standards for cloud computing.
Yes, Sumo Logic's installed collectors can be deployed on AWS Graviton instances to collect important telemetry. Version 19.403-1 and above support deployment on Linux ARM/Aarch64-based instances. We are happy to support organizations using Graviton processors to optimize the cost of workloads running in EC2.
Adopt the latest microservices technologies confidently using Sumo Logic’s native integrations for Kubernetes, Docker, AWS EKS, and AWS Lambda.

No credit card required. Up and running in minutes.
More than 2,100 enterprises around the world rely on Sumo Logic to build, run, and secure their modern applications and cloud infrastructures.
