
2022 Gartner® Magic Quadrant™ SIEM
Get the report
MoreTrusted by thousands of customers globally.
Browse our library of ebooks, briefs, reports, case studies, webinars & more.
With Sumo Logic Real User Monitoring (RUM), you can surface user journey, website performance and application performance data for complete visibility into the end-user experience.


Don’t play guessing games. Improve your end-user experience and get to the bottom of application performance issues faster with website monitoring, enriched data, machine intelligence and distributed tracing.
Sumo Logic supports XML HTTP Requests (XHR) and navigation changes to fully understand user interaction from navigating in-browser apps using single-page apps (SPA) frameworks.
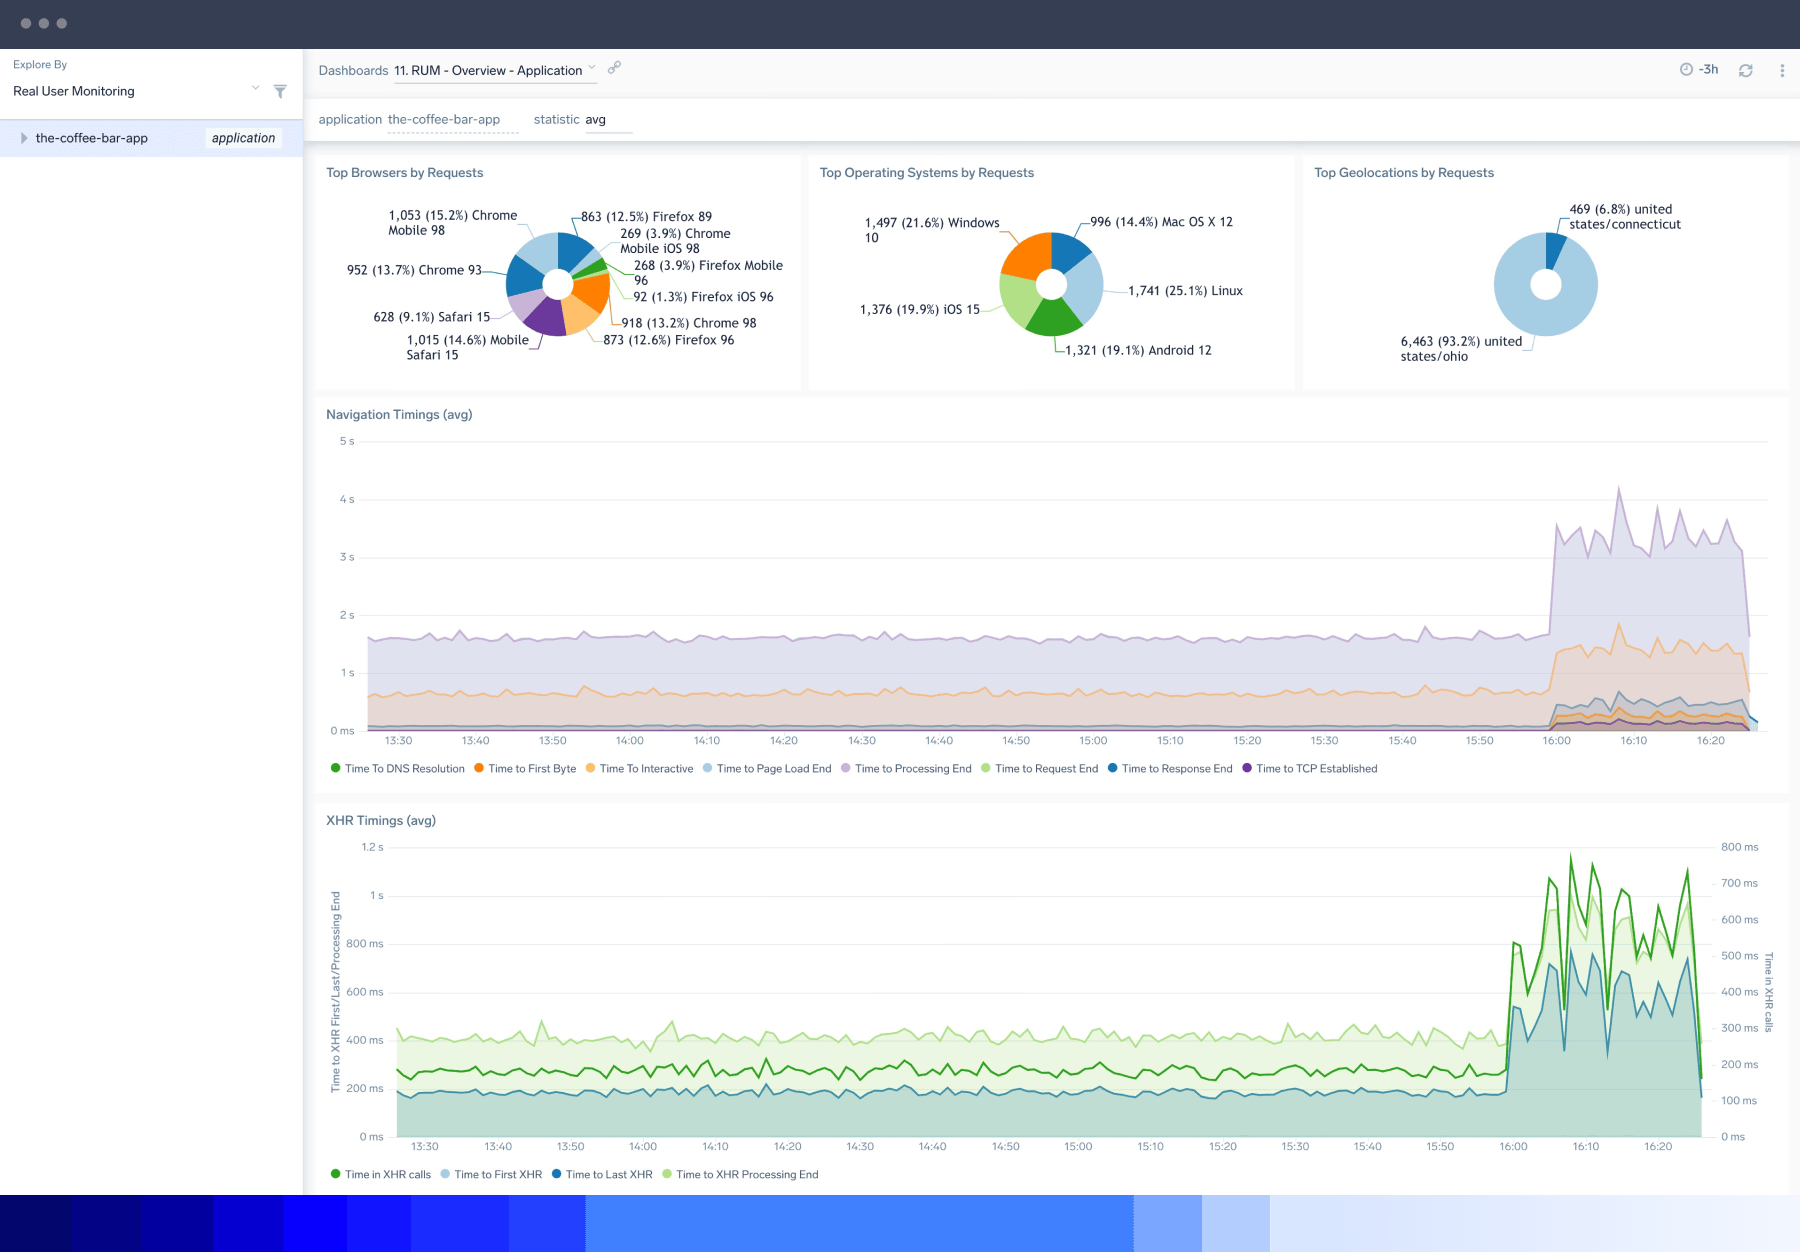
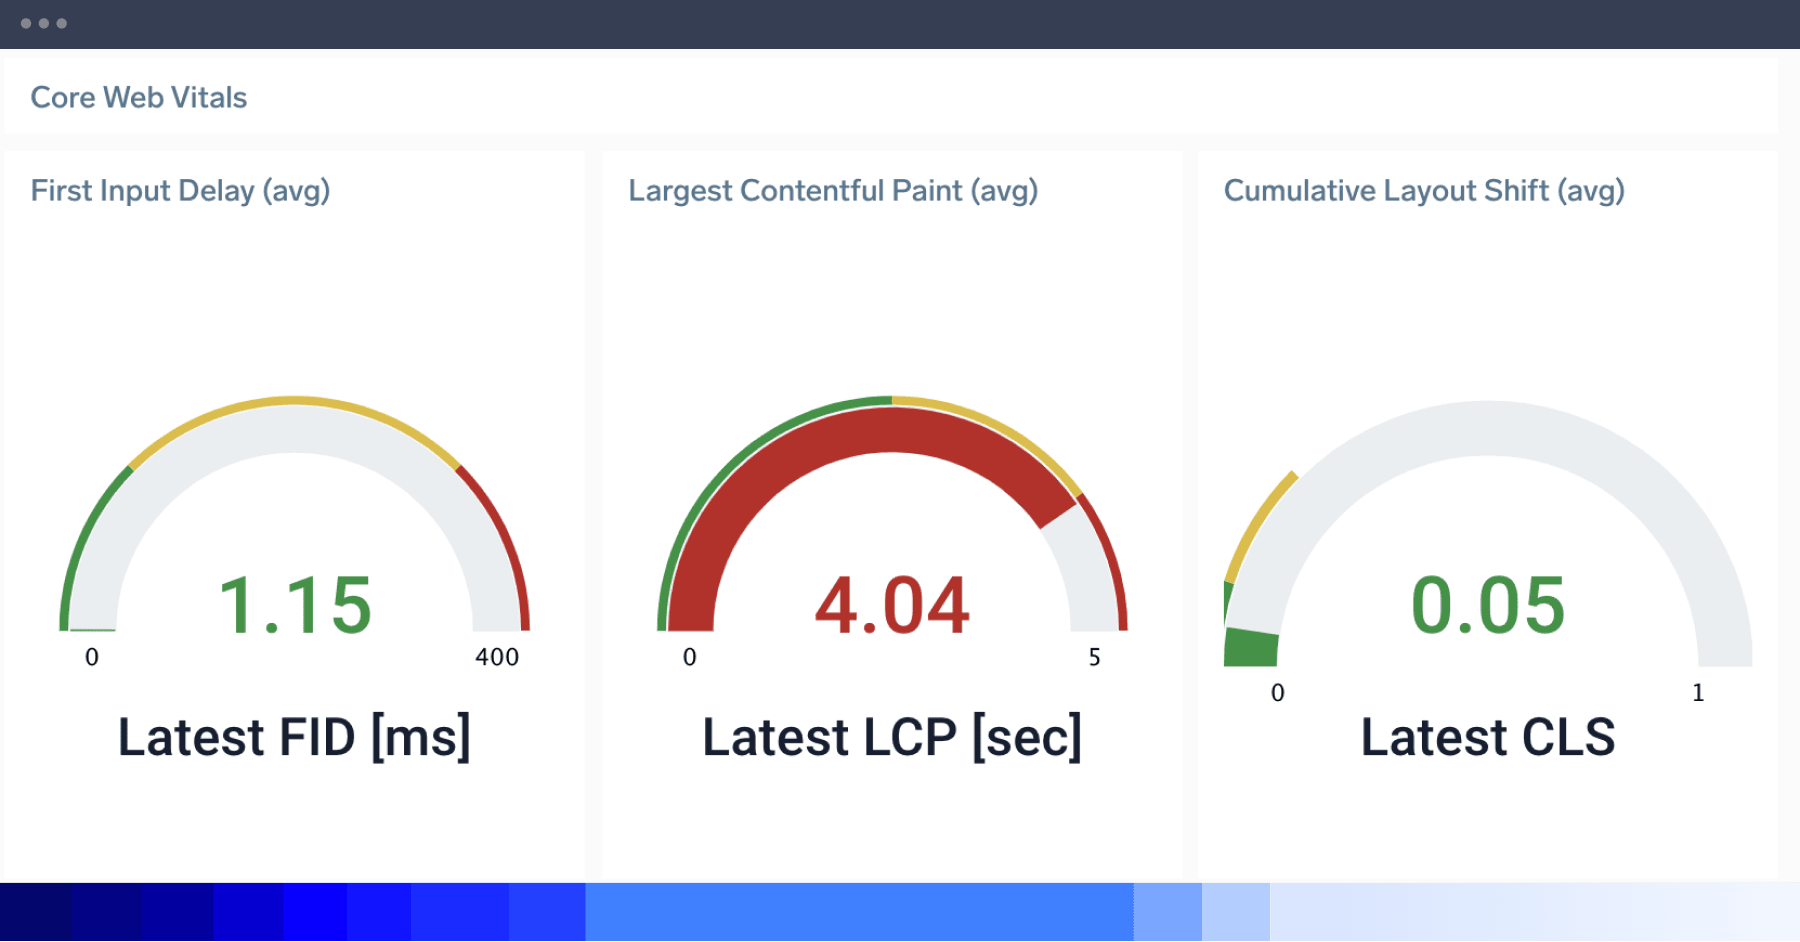
Sumo Logic monitors real user metrics, including detecting performance problems like rendering times and core web vitals for visibility into how fast pages load, interact and render in a single overview dashboard.
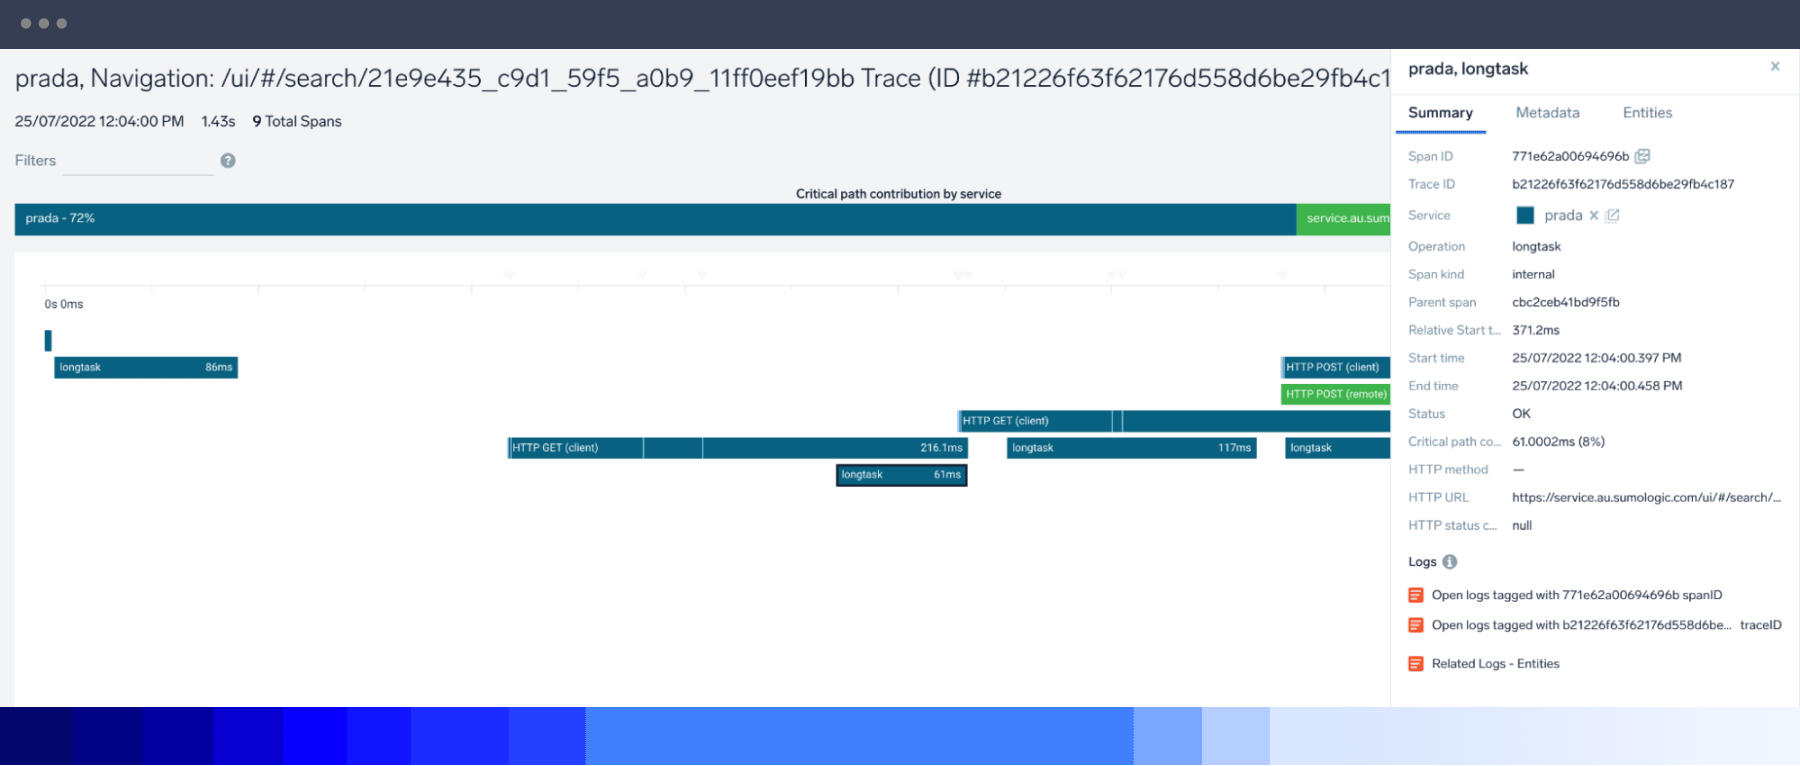
Sumo Logic’s RUM solution automatically captures longtask delay events, displaying them as individual spans and dashboard charts, so that you can identify and reduce browser freeze times.
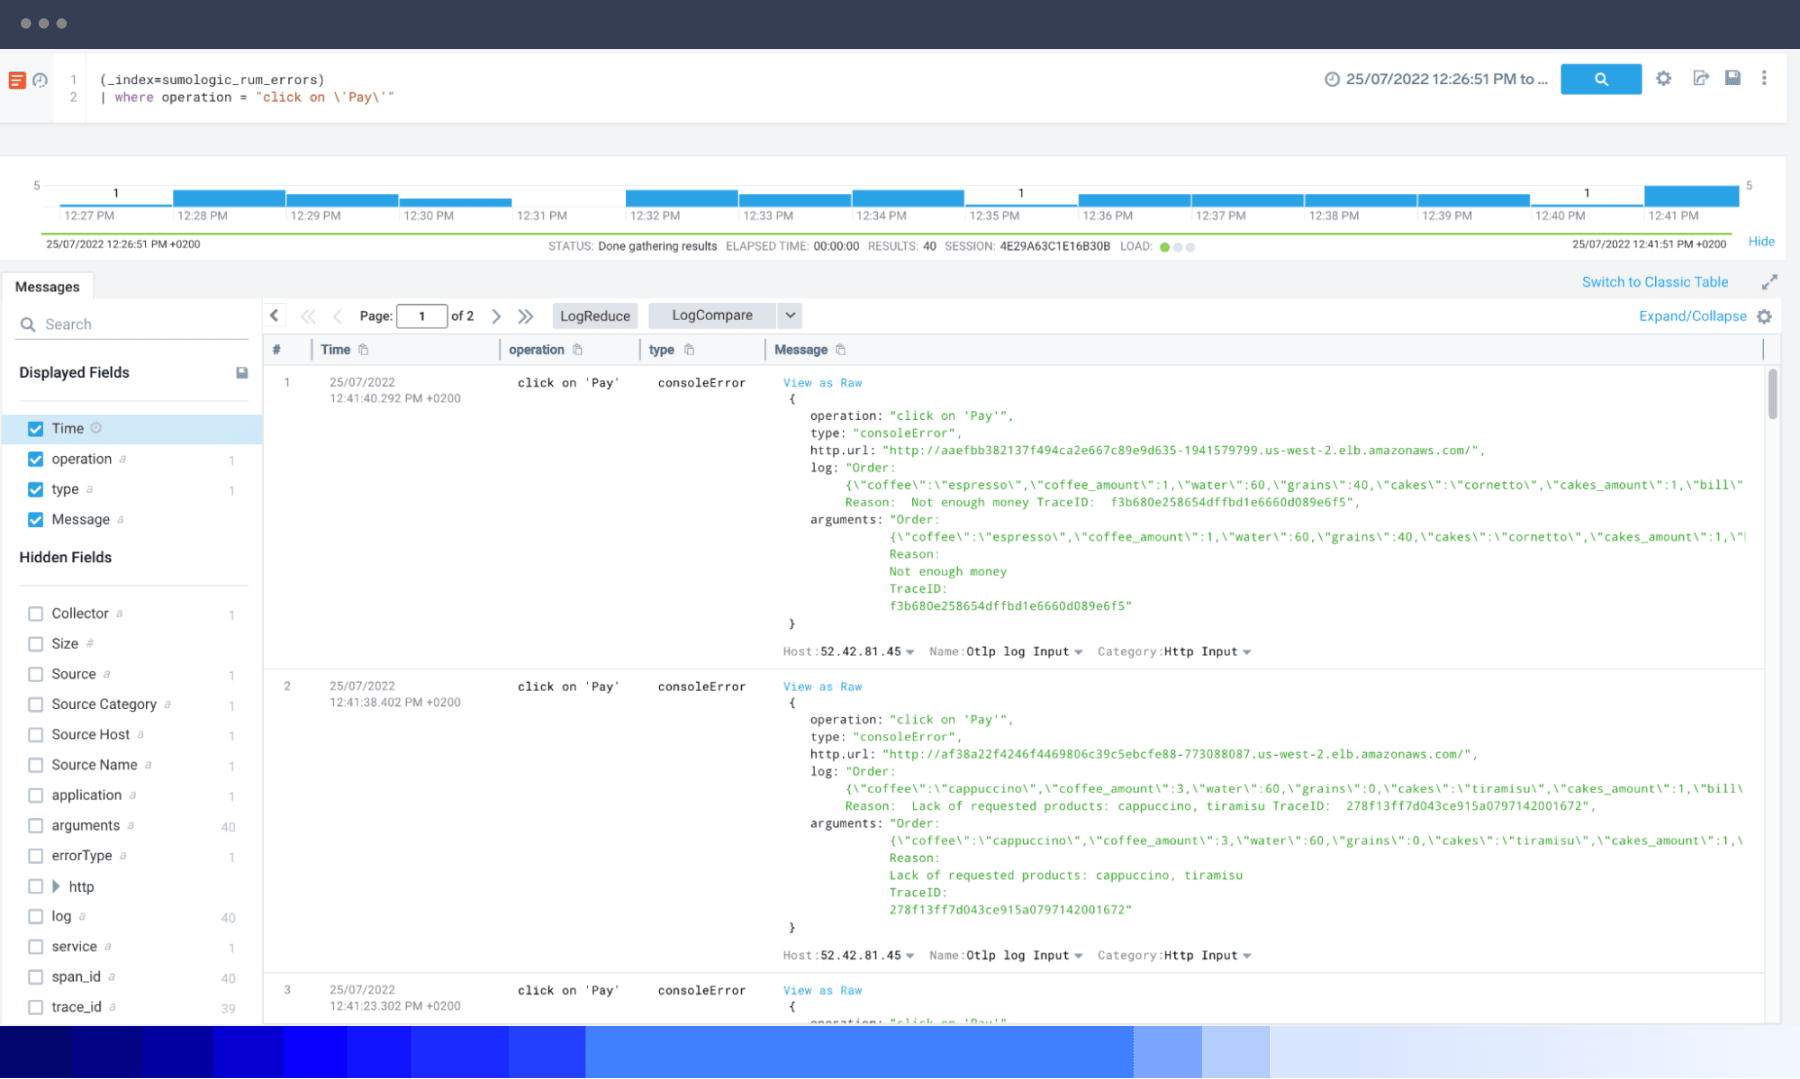
Automatic log data collection at the client’s browser provides frontend developers full visibility into error categories from browser applications with contextual drill-down, including unhandled exceptions, rejections and console errors.
Sumo Logic RUM is an OpenTelemetry JavaScript distribution, fully compatible with the standard for easy data collection across platforms. Both spans and logs are transmitted using OTel Line Protocol (OTLP).

Track user behavior and online experience to optimize app performance and digital customer experience.
Rapidly pinpoint where application frontend degradation is occurring and the backend services that might be impacting it.

Accelerate data synthesis and analysis of application telemetry in seconds with machine intelligence via charts and histograms.

Use a unified platform to ingest, analyze and correlate all application and infrastructure open-source standardized telemetry to identify and diagnose issues quickly.


RUM provides insights into how end-users experience your web application in their browser. By determining how long activities such as Time to First Paint or Time to Interactive take, RUM enables developers to understand customer experience better and ensure the reliability and performance of SaaS-based services.
It also allows the inspection of each transaction’s end-to-end progress, with data from the browser tied to every service and backend application call. Because RUM covers critical KPIs, like DNS lookup and SSL setup time, as well as how long it took to send the request and receive a full response from the client's browser, observers can compare user cohorts defined by their browser type or geographical location to understand their performance as a group. This information helps performance engineers optimize application response times, rendering performance, network requirements and browser execution to improve the user experience.
There are six basic steps to RUM:
Data capture of details about requests for pages, images, and other resources from the browser and web servers.
Detecting unusual or problematic behavior, such as slow response times, system problems and web navigation errors for different pages, objects, and visits.
Reporting of individual visit activity with a summary of data or simulation of user experience with synthetic transactions.
Segmenting aggregated data to identify page availability and performance across different browsers and user cohorts.
Alerting whenever a system spots a serious issue.
Tying end-user experience problems to backend performance automatically per each end-to-end transaction.
Create business objectives to establish overall business goals for RUM. What will the data help you achieve? Concrete goals will ensure you use RUM tools for the right reasons and that there is consistent leadership buy-in.
Ensure that business objectives align with the same goals as the engineering and development teams. Make sure that technical teams monitor metrics that meet business objectives.
Implement RUM across all user experiences
Test your RUM on development and staging environments before deployment and release.
Synthetic monitoring tests synthetic interaction for web performance insights, while RUM exposes how your actual (real) users interact with your site or app. RUM offers a top-down view of a wide range of frontend browsers, backend databases and server-level issues as your users experience them.
RUM data reflect the experience of current application users, while synthetic monitoring is a more predictive strategy for developers to conduct tests on a hypothetical basis. Additionally, RUM goes beyond the simple up/down availability and page load monitoring of synthetic monitoring. It provides end-to-end transaction reporting and analysis to pinpoint where problems happen and how to resolve them.
RUM and application performance monitoring (APM) are different but related methods of IT monitoring that share a goal: improved application performance. APM is an umbrella term that includes RUM as one of its strategies. RUM supports APM by analyzing how end-user experience informs application optimization strategies.
RUM doesn’t purely serve as part of an APM strategy. Because RUM tracks user activity with the frontend, RUM data can answer user experience questions pertaining to customer satisfaction to help developers optimize application features.
The Sumo Logic OpenTelemetry auto-instrumentation for JavaScript library enables RUM data collection in the form of OpenTelemetry-compatible traces and logs directly from the browser. It gathers information about the load, execution, and rendering of your JavaScript applications and records the browser-to-backend performance of every user transaction in real-time, without sampling.
This data is gathered directly from your end-user devices and displayed as individual spans representing user-initiated actions (like clicks or document loads) at the beginning of each trace, reflecting its request journey from the client throughout the whole application and back. This includes any unhandled errors, exceptions, and console errors generated by the browser. Then data is aggregated for high-level KPIs displayed on out-of-the-box dashboards.
All data collected is compatible with OpenTelemetry and doesn't use proprietary vendor code. RUM supports document load actions, XHR communication and route changes for single-page app navigation. The full list of functionalities and configuration is available in the Sumo Logic OpenTelemetry auto-instrumentation for JavaScript README file.
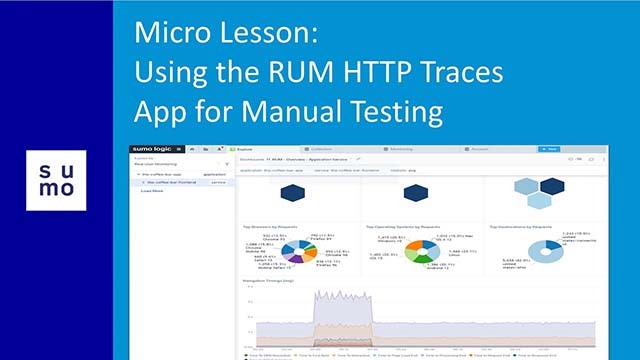
Browser traces automatically generate RUM metrics aggregates in the Sumo backend. They provide insight into your website's frontend overall user experience for automatically recognized top user actions and user cohorts categorized by their browsers, operating systems and locations.
RUM organizes metrics by user actions representing document loads. This means actual retrieval and execution of web documents in the browser; XHR calls related to, e.g., form submissions or button presses, as well as route changes that are typical navigation actions in Single Page Apps. Metrics are presented in the form of charts and maps on the Website Performance panels on RUM dashboards and as individual measurements inside each frontend originated spans in end-to-end traces representing individual user transactions.
Metrics types include:
Document load metrics collected for document load and document fetch requests, compatible with W3C navigation timing events. They can help you understand the sequence of events from user clicks to a fully loaded document.
Time to first byte measures the delay between the start of the page load and when the first byte of the response appears. It helps identify when a web server is too slow to respond to requests.
Rendering events explain rendering events inside the user's browser. Learn more in our documentation.
First Input Delay (FID): measures interactivity to provide a good user experience.
Largest Contentful Paint (LCP): measures loading performance to provide a good user experience.
Cumulative Layout Shift (CLS): measures visual stability to provide a good user experience.
XHR monitoring metrics representing how much time was spent in background Ajax/XHR communication with the backend related to data retrieval. Longtask delay indicates when the main browser UI thread becomes locked for extended periods (greater than 50 milliseconds) and blocks other critical tasks (including user input) from being executed, impacting the user's experience. Users can perceive this as a "frozen browser”, even if the communication with the backend has long been completed.
Learn how you can optimize your digital customer experience across your web apps.

No credit card required. Up and running in minutes.
More than 2,100 enterprises around the world rely on Sumo Logic to build, run, and secure their modern applications and cloud infrastructures.
