
2022 Gartner® Magic Quadrant™ SIEM
Get the report
MoreTrusted by thousands of customers globally.
Browse our library of ebooks, briefs, reports, case studies, webinars & more.
April 15, 2021
In a recent experiment with my colleagues, I polled them about the following:
“What would they do if the lights went out as you worked at night?”
Besides identifying the funny and who-you-want-in-case-of-an-emergency responses, most of my colleagues checked to see if the problem might be broader than their own home. A few sample responses:
“..first thing would be to think "WTF? Then check the fuse box.”
“Make sure the fuse didn't blow. Then check for power outages in my area.”
“Look over to my balcony to see if my neighbors' lights are out.”
“Check my home appliances to see if they are working, check twitter and PG&E feed to see if other people have reported this issue.
“Grab my phone and turn on the flashlight. Then I proceed to see if it’s an outage across my full house. From there, I look at PGE.com’s status page. If it’s a neighborhood outage, then I try to see if there is an ETA.”
“If you are in Helsinki in the summer it's lit almost 22 hr a day so it won’t really matter. If lights go out and not the power, and if other things are working (for example TV) I may do nothing.”
“Check appliances/devices in my apartment to make sure it’s a power outage and not just lights. Connect to my phone wifi to make sure work is synced. Check on the utility provider for status updates.”
“..complete what i was working on (because the wifi would be on backup) and wait for lights backup to kick-in. Power outages are common occurrences in India, so most apartments have power backups which run on diesel (which takes a minute or two to kick-in).”
“I look outside to see if it’s just my apartment or the entire block.”
“Grab my phone to see if my energy provider has a known outage.”
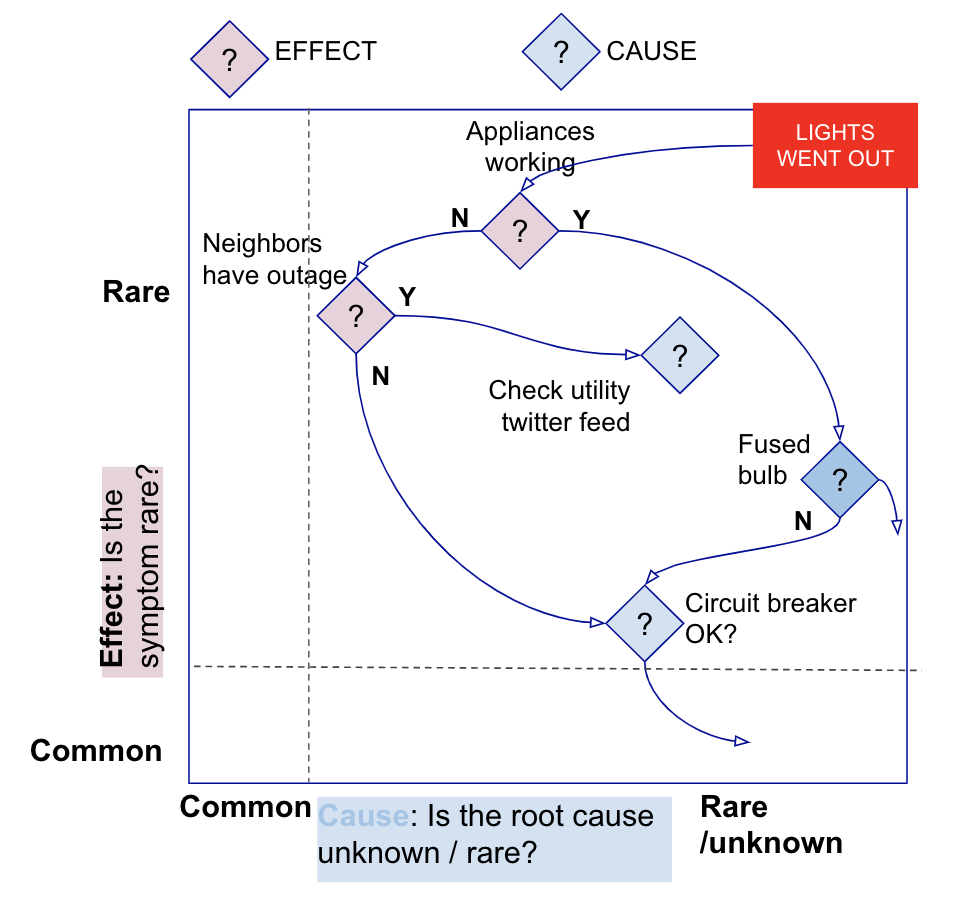
This simple experiment illustrates that troubleshooting starts from a rare effect (e.g. “lights went out”) with an unknown cause. It relies on expanding context from the immediate environment (e.g. “my home” to the neighborhood) to encompass more and more cause and effect signals that are progressively eliminated or confirmed. In this article, we show how benchmarks of infrastructure and app component signals can accelerate incident resolution when presented contextually to an on-call troubleshooter.
Consider the highly simplified mobile banking application shown below. In this example, the app is built on Kubernetes and AWS infrastructure. Consumers trigger bill payment transactions from the nginx Load Balancer to the payment-service orchestrated by Kubernetes. The payment-service posts transactions to the accounts-service (another Kubernetes service) which stores transactions in the RDS database.
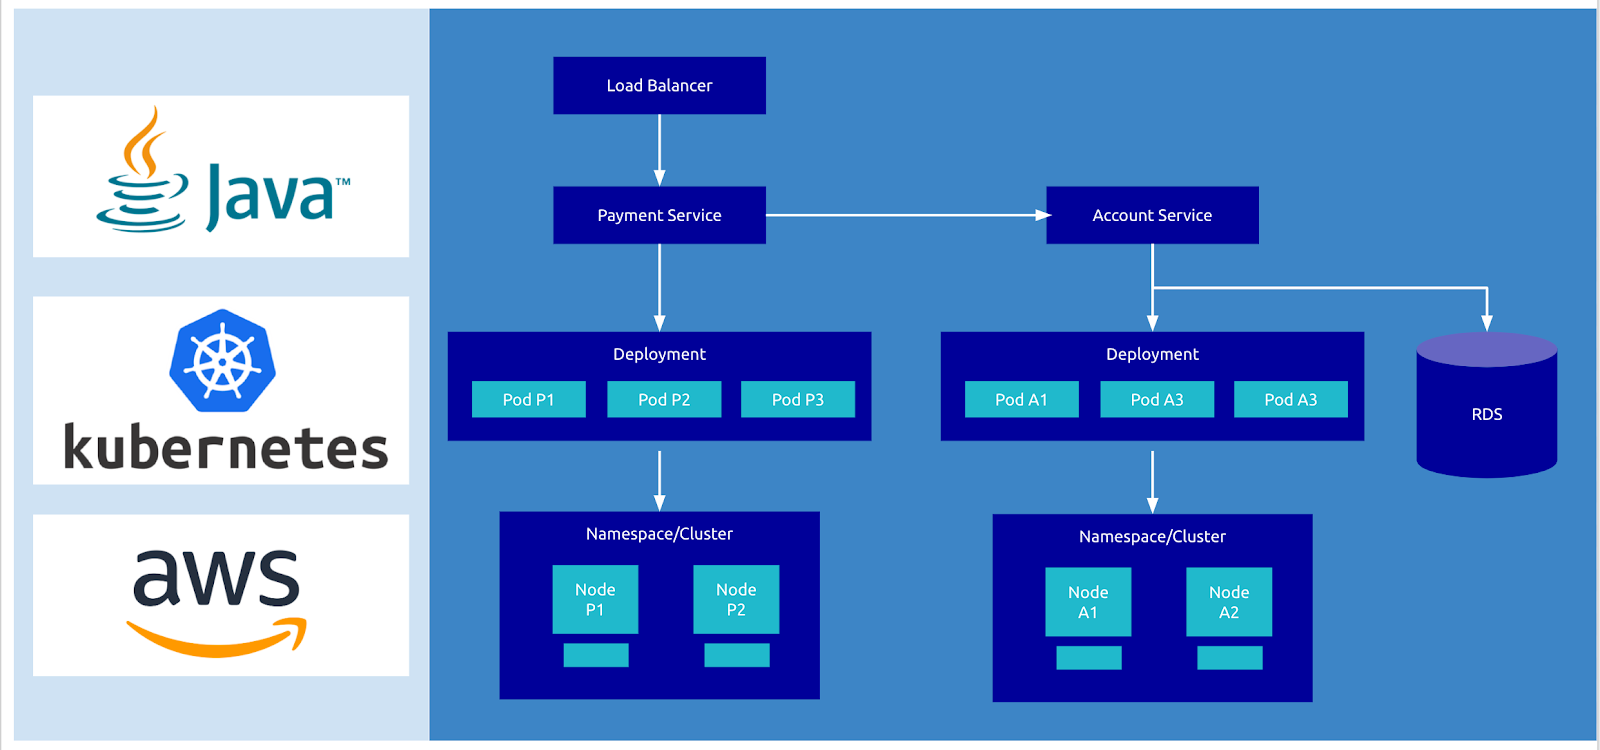
An elevated error rate for the payment service would be the first sign of trouble that triggers an alert to an on-call engineer. The engineer would have to hypothesize and diagnose several scenarios that might be causing the elevated errors.
A problem with the payment-service itself or the accounts-service it depends on
A problem with the Kubernetes deployment
A problem with cloud nodes (e.g. AWS EC2 instances) used by the pods
A problem with any other cloud infrastructure or platform service (e.g. AWS RDS, nginx)
Suppose the user chooses to eliminate Nginx as a cause of the incident. Below we discuss how benchmarks for Nginx, derived from lots of Nginx servers, can help in this context.
Example: How might benchmarks for Nginx help accelerate resolution?
One benchmark the troubleshooter could leverage is the server (5XX) errors per request derived from a population of 18,300 Nginx servers analyzed by Sumo Logic. Note that two golden signals (load and error) are encoded in this benchmark along with a normalization based on requests. Note also that load signals are a cause while errors are an effect.
The median (p50) nginx server in the Sumo Logic customer population has 7% server-error rate (per request). During the past 7 days, our server has been tracking to p25 of error rate as shown in the figure. During the incident, the nginx server has a rate, say 50%, which would put the server in the p75 of servers. This could imply one of the following:
Something changed in the backend. Depending on the magnitude of the drift (e.g. 8% today v 7% yesterday) might help you decide where to look. In this case, given the jump from p25 to p75 on the error rate benchmark, backend issues are a definite possibility.
Keepalive connections, caching, limits (e.g. queue) or worker processes reduced
More bot activity - leading to more requests and more errors - this is another signal in Global Intelligence for Nginx
More GB served per request (e.g. by reducing compression settings) - this is another signal in Global Intelligence for Nginx
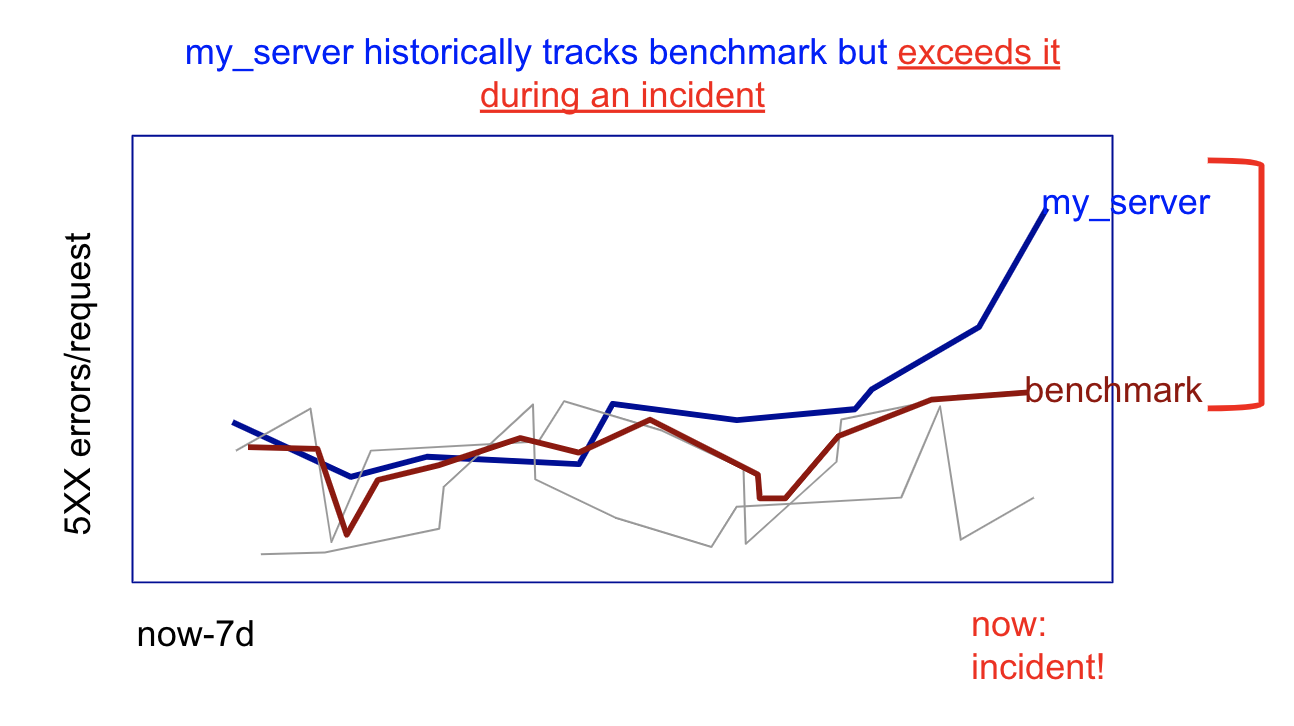
But, even as the picture shows, one could infer a backend issue simply by looking at the server’s history- anomaly/outlier detection on my_server data would detect it. Why do we need a benchmark? There are at least three reasons:
As discussed above, it is important to eliminate the app component (Nginx in this case) itself as the cause of the incident. A benchmark can help by tracking cause-effect relationships and configuration best practices as shown above.
Errors tend to be very tricky to monitor via anomaly detection. Most distributed service and infrastructure systems have 0 errors most of the time and anomaly/drift calculations run into the "divide by zero" problem because the baseline/expected value of errors is zero. So, deciding whether even a single error or 100 errors counts as an anomaly is hard to fathom without benchmarks for a particular domain. When we err on the side of a single error signaling an incident, we might subject users to false alarms. In short, a benchmark can help validate and prioritize a given entity’s anomalies.
A population benchmark is like a symptom check that helps you decide relative urgency of a medical need. For COVID-19, for example, "low grade" fever and "loss of taste/smell" are "expected" but “shortness of breath” is urgent. In each case, you are comparing yourself to past history (symptom or no symptom) but the extent of the drift relative to population experiences drives your call to action, if any. In this sense, one could argue that very large deviations from a benchmark represent changes that are not merely temporal anomalies but anomalies that defy norms for particular domains like the Web Tier, requiring urgent attention.
The benchmarking methodology in Global Intelligence involves the following steps:
What outcomes do we want the benchmark to serve?
Translate the outcomes to hypotheses that can be verified by benchmarking. For example, are Nginx errors correlated with request rates, bot activity, connection rate, GB served per request and so on? If yes, we can predict errors (the effect) from the request rate, GB/request and other factors (the causes).
Global Intelligence for AWS CloudTrail DevOps, given its outcome of AWS problem detection or elimination, analyzes every combination of account, region, namespace and API name, every minute and summarizes signals every 6 hours and daily.
Global Intelligence for Nginx analyzes nginx servers with hourly observations to support root cause analysis or elimination of Nginx issues.
Global Intelligence for Kubernetes DevOps analyzes cluster, namespace, deployments and containers to recommend resource settings that minimize cost and outage risk. Deviations from recommended cpu/memory settings can be important contextual clues during Kubernetes-related incidents.
Construct anonymized and normalized signals using log or metrics queries and execute them nightly on our data platform. Normalization is key to meaningful comparisons.
Detect deviation between a given organization’s entities and the benchmarks and how the entity’s position has changed relative to the benchmark in recent history.
Surface insights to the user during troubleshooting.
Benchmarks can enrich incident context and accelerate troubleshooting. They do this by adding crowdsourced context to signals, such as errors, observed during an incident. Benchmark context also helps validate and prioritize anomalies detected from an entity’s own past baselines. Large deviations of an entity from benchmarks require urgent attention.
Reduce downtime and move from reactive to proactive monitoring.
Build, run, and secure modern applications and cloud infrastructures.
Start free trial

No credit card required. Up and running in minutes.
More than 2,100 enterprises around the world rely on Sumo Logic to build, run, and secure their modern applications and cloud infrastructures.
