
2022 Gartner® Magic Quadrant™ SIEM
Get the report
MoreTrusted by thousands of customers globally.
Browse our library of ebooks, briefs, reports, case studies, webinars & more.
 In this article
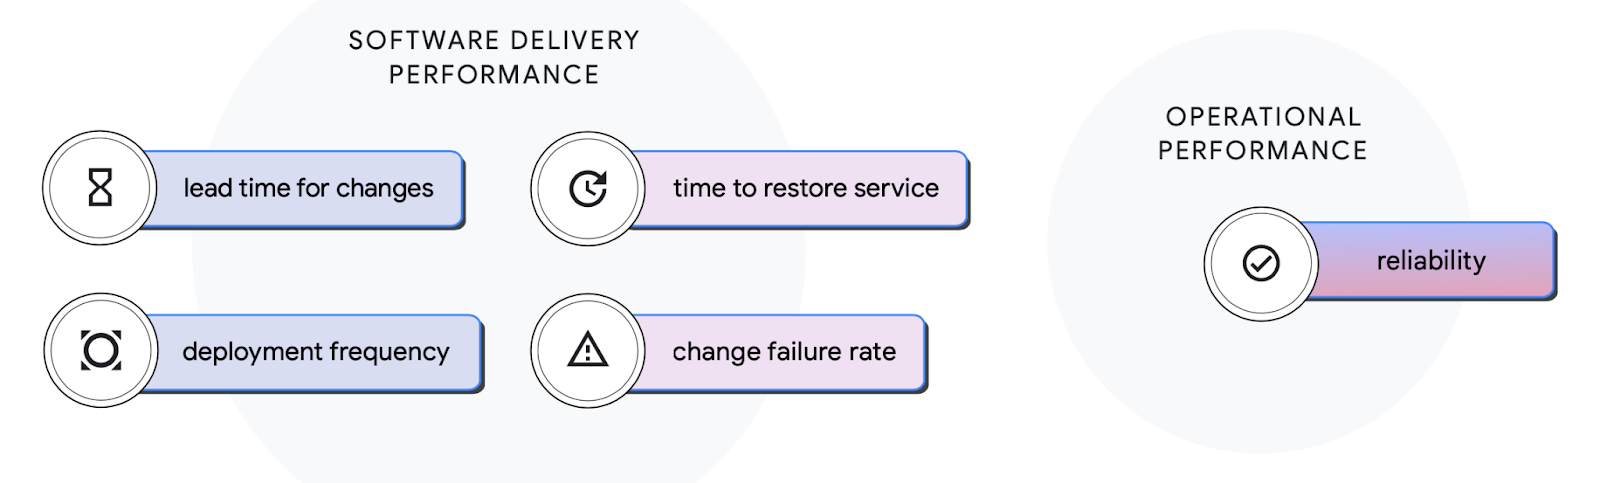
DORA metrics measure five elements related to software delivery performance and are split between velocity and stability—the result of seven years’ worth of surveys conducted by DevOps Research and Assessments group.
Velocity metrics
Deployment frequency (DF) - How frequently code is being deployed
Mean lead time for changes (MLT) - Time from code commit to production
Stability metrics
Mean time to recover (MTTR) - Time to restore service after an incident
Change failure rate (CFR) - Percentage of changes causing a failure
It’s important to note the group recently added a fifth critical metric—reliability—related to operational performance and is complementary to the four metrics above on software delivery performance.
DORA metrics help DevOps and engineering leaders measure software delivery throughput (velocity) and stability (quality) by providing visibility into how development teams’ work is progressing, where blockages are slowing that work, and if the quality of code being deployed is reliable or issues are causing a disruption in the user experience. These metrics help leaders understand how their teams are performing now and over time to make data-driven decisions to improve the process, the teams and the applications. Put simply, it measures how well the engineering teams are performing and how successful a company is at delivering software, ranging from “low performers” to “elite performers.” They help answer the question: Are we better now than we were a year ago?
At most software organizations, DORA metrics are closely tied to value stream management, which helps an organization track and manage the flow of development work, or value, from the idea stage to delivery. As a proven set of DevOps benchmarks, DORA metrics provide a foundation for this process. They identify inefficiencies or bottlenecks in the process, slowing the flow of work, and you can use that information to streamline or automate steps to ship faster by removing those bottlenecks. When your teams’ DORA metrics improve, the efficiency of the entire value stream improves along with them.
Additionally, the inclusion of reliability in the DORA metrics, as a measure of operational performance, means that site reliability engineering (SRE) and DevOps are complementary, and some may say essential, to be a high performer in software development and delivery. DevOps teams that leverage modern operational practices outlined by their SRE colleagues report higher operational performance. Teams that prioritize both delivery and operational excellence report the highest organizational performance.
Deployment frequency (DF) - refers to the cadence of an organization’s successful releases to production. Teams define success differently, so deployment frequency can measure a range of things, such as how often code is deployed to production or how often it is released to end users. Regardless of what this metric measures on a team-by-team basis, elite performers aim for continuous deployment, with multiple daily deployments.
Mean lead time for changes (MLT) - measures the time it takes from code commit to production. It helps engineering and DevOps leaders understand how healthy their teams’ cycle time is, and whether they can handle a sudden influx of requests. Like deployment frequency, this metric provides a way to establish the pace of software delivery at an organization—its velocity.
Mean time to recovery (MTTR) - measures the time it takes for a team to restore service in the event of an unplanned outage or another incident. This data point is the team’s mean time to recover. It is critical to restore service as quickly as possible (with a low mean time to recover). Leading performers improve this metric with the help of robust monitoring, efficient root cause analysis and remediation for the applications and the tech stack components.
Change failure rate (CFR) - refers to how often their changes lead to failures in production. Rollbacks, failed deployments, and incidents with quick fixes—regardless of the root cause—all count toward the change failure rate. Like the mean time to recover, this metric helps measure stability. How much developer time is diverted into tasks that don’t contribute to innovation? Understanding the change failure rate helps leaders decide where to invest in infrastructure to support development teams.
Reliability - is the fifth metric that measures modern operational practices. The primary metric for operational performance is reliability, in which a team can meet or exceed the reliability targets for the software and applications they operate. Reliability is a broader measure that includes availability, latency, performance, and scalability that measures:
User-facing behavior
SLI/SLO metrics and how they affect error budgets
Use of automation to reduce manual work and alert fatigue
Defined playbooks to respond to issues
Level of reliability incorporated into the software delivery process.
It’s been determined that teams with different delivery performance levels see better outcomes when prioritizing reliability as an element to improve operational performance.
This fifth metric brings together DevOps and SRE teams and shows that taking on SRE practices in the software development and delivery process makes sense. Since SREs and DevOps teams embrace the same goals and techniques, there should be no confusion about picking one over the other because they complement building great software that customers want to use.
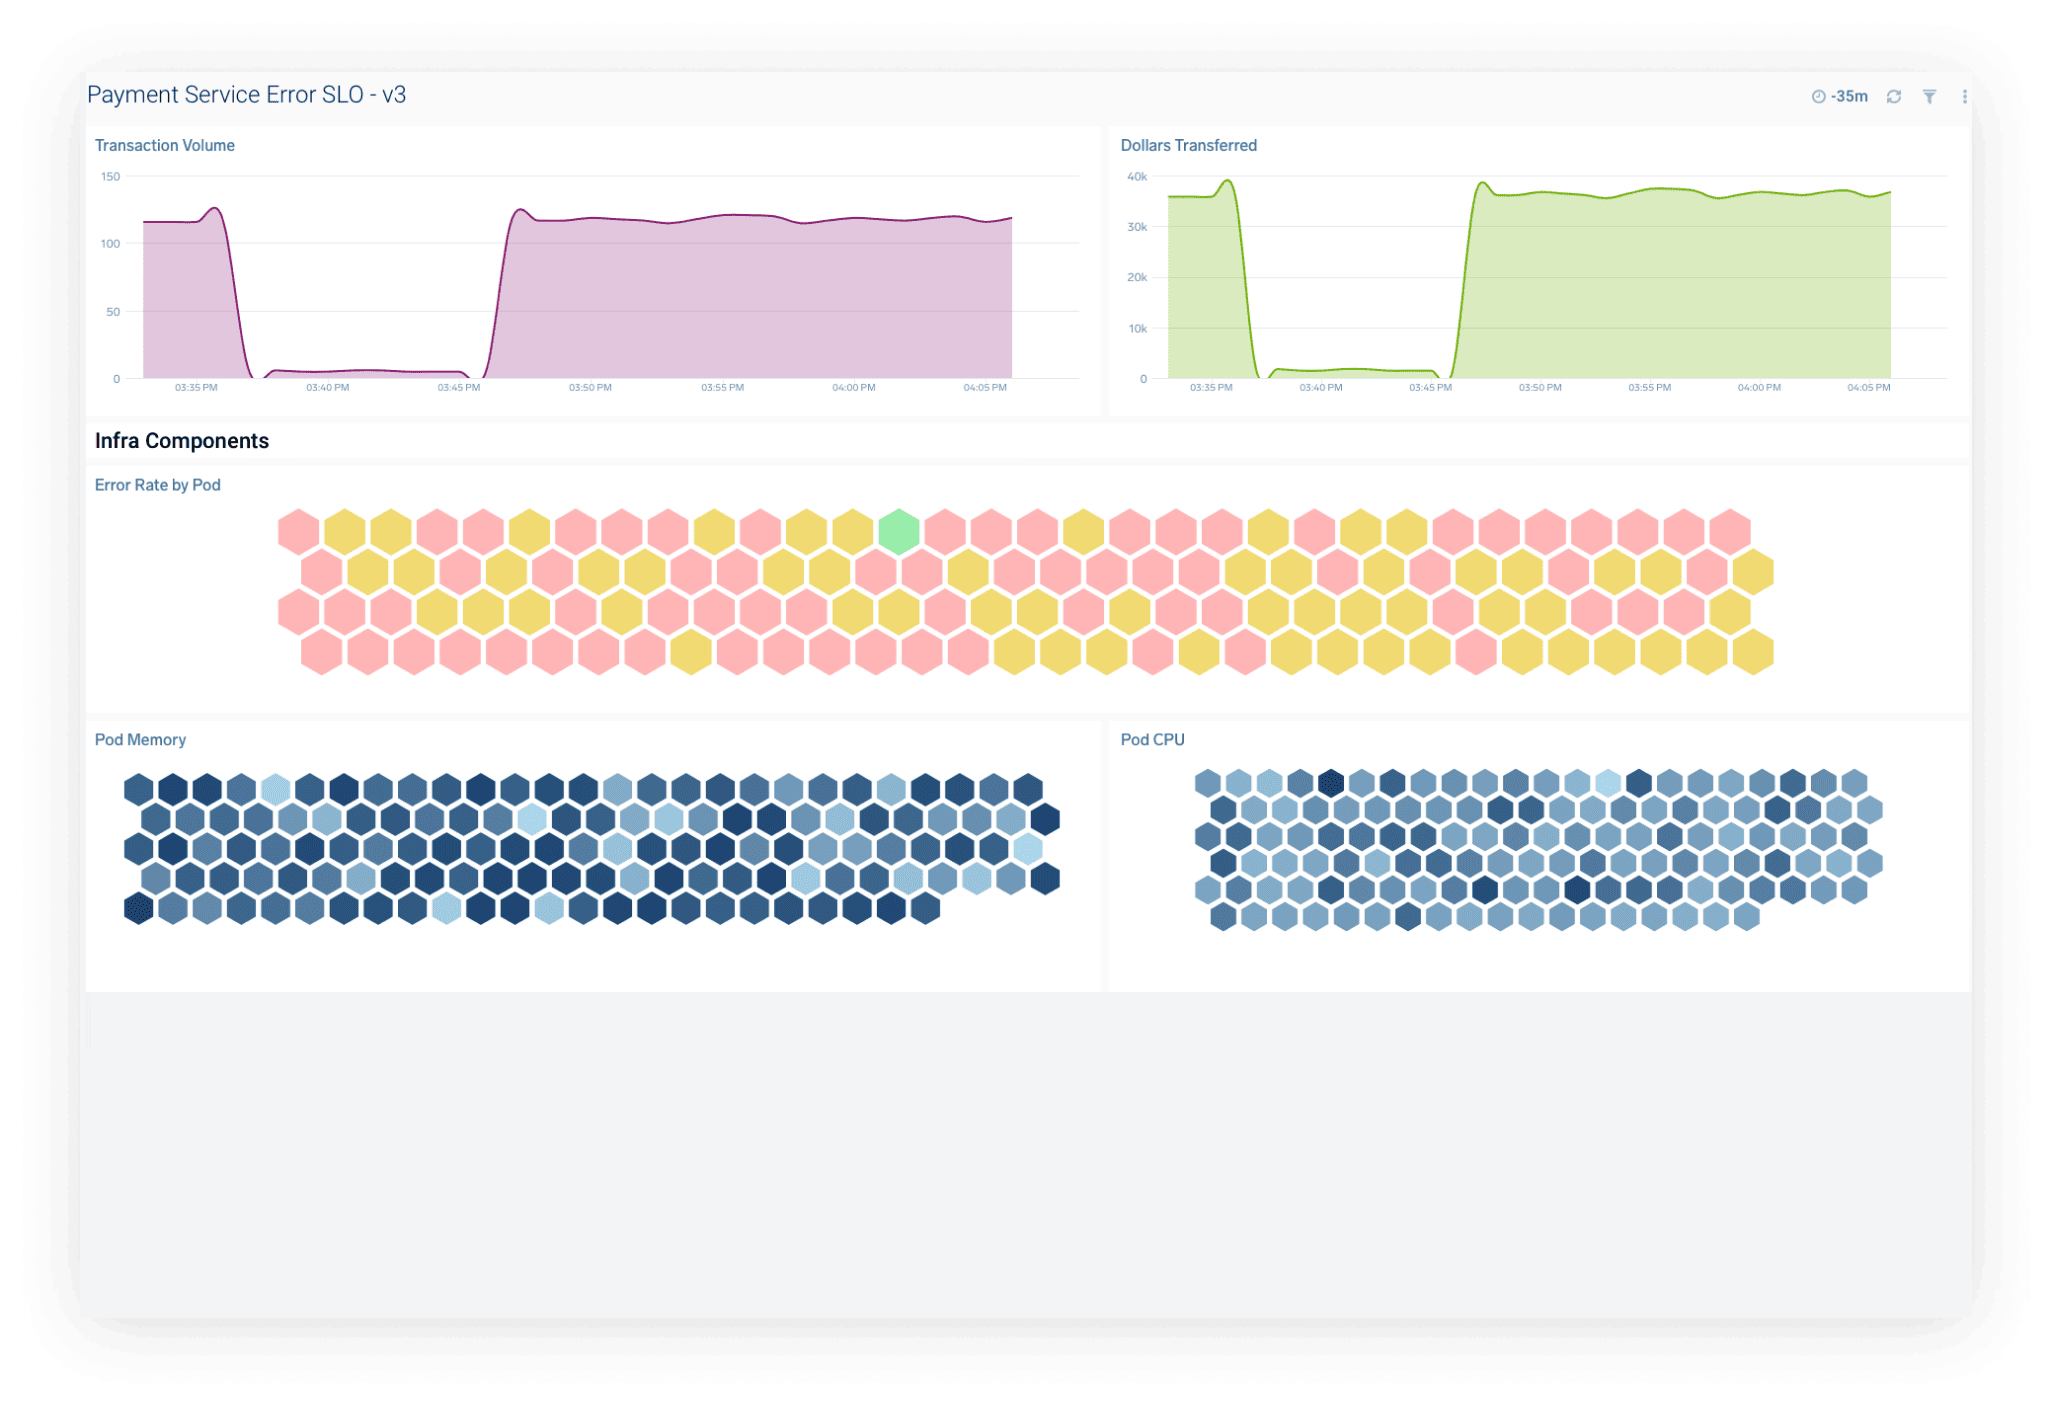
Product and engineering teams are focused on frequently delivering reliable software to their customers, which translates to positively impacting business goals. And this is why they value robust observability platforms, like Sumo Logic, to help them measure their objectives and ensure they’re on track to meeting their KPIs, deadlines, and long-term strategies.
Try Sumo Logic’s free trial today to see how we can help you reach your goals and maintain quality assurance today.
Reduce downtime and move from reactive to proactive monitoring.


No credit card required. Up and running in minutes.
More than 2,100 enterprises around the world rely on Sumo Logic to build, run, and secure their modern applications and cloud infrastructures.
