
2022 Gartner® Magic Quadrant™ SIEM
Get the report
MoreTrusted by thousands of customers globally.
Browse our library of ebooks, briefs, reports, case studies, webinars & more.
January 31, 2023

The software industry has seen many evolutions. There is a new disruption in the market every five years or so.
Software testing cannot remain isolated from all the latest trends and technologies. Testing strategies need to keep up with agile development, faster deployments and increasing customer demand for reliability and user-friendly interfacing. They need to be able to grow just as quickly and just as reliably as the business logic.
We have seen quality engineering (QE) processes evolve from test automation to autonomous testing, so let's talk about a new requirement for growth: test observability.
Test observability means deriving continuous insights from your automation infrastructure and using them to make crucial decisions around product stability, reliability, and speed gaps in continuous deployment. It also helps you ensure that you spend your time and money running tests where they are needed and get a bird's eye view of your entire system through these automated tests.
You can create a complex testing infrastructure using various tools, frameworks and processes. However, the cost of maintaining and monitoring that infrastructure and ensuring it actually does what it says is a whole different problem.
Test observability helps us answer a lot of important questions about the efficiency of our processes and our tests. At Sumo Logic, we use our own platform just as our customers do, which means we’ve already gone down this path and can share some key learnings.
A few of the challenges we have faced at Sumo Logic as we expanded our offerings were:
Getting consolidated health status for all our deployment locations
Identifying the blast radius of a change
Finding common patterns among test failures
Monitoring test ROI
By collecting our test automation data we are able to find relevant information and take targeted action without much operational delay. Let’s talk about how we solved these problems by adopting Test observability using Sumo Logic and how it added value to the company.
Sumo Logic integrates automation data for easy monitoring of test health and quick incident isolation, with correlation to upgrades and releases.
By integrating the data from your automation infrastructure directly into Sumo Logic, you are able to easily monitor the overall health of your deployments and quickly identify any inconsistencies. The visual representation of the test health and segregation by type, such as feature area, location, or type, helps you make informed decisions and take prompt action in the case of any issues.
To support your investigations, you can set up custom dashboards that allow you to drill down into the data and analyze it from multiple angles. The clarity provided by the visual representation makes it easier to understand the test results, and it also helps you escalate any issues you encounter more quickly, ensuring your deployment remains healthy and reliable.
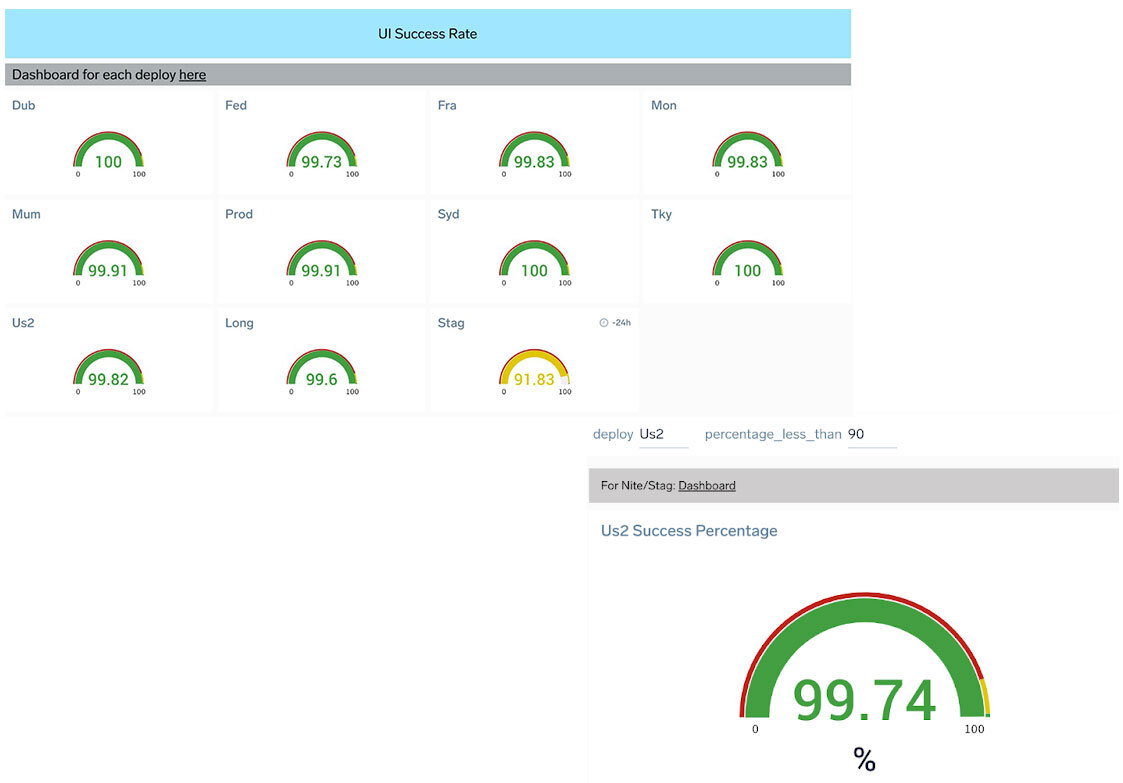
You can plug in the URLs to the failing jobs directly into the dashboard, so going to the exact build/job is as simple as clicking a button. You can set up default thresholds and modify the deployments using Template Variables.
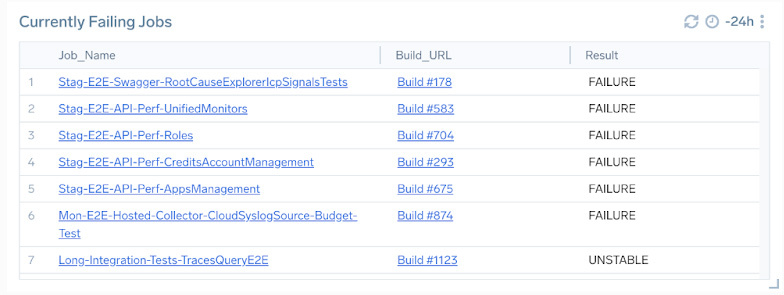
When a test fails intermittently for the same reason, you may wonder if it’s truly a pattern. Checking the same test across multiple deployments can be painful and exhausting with hours of manual work investigating historical data.
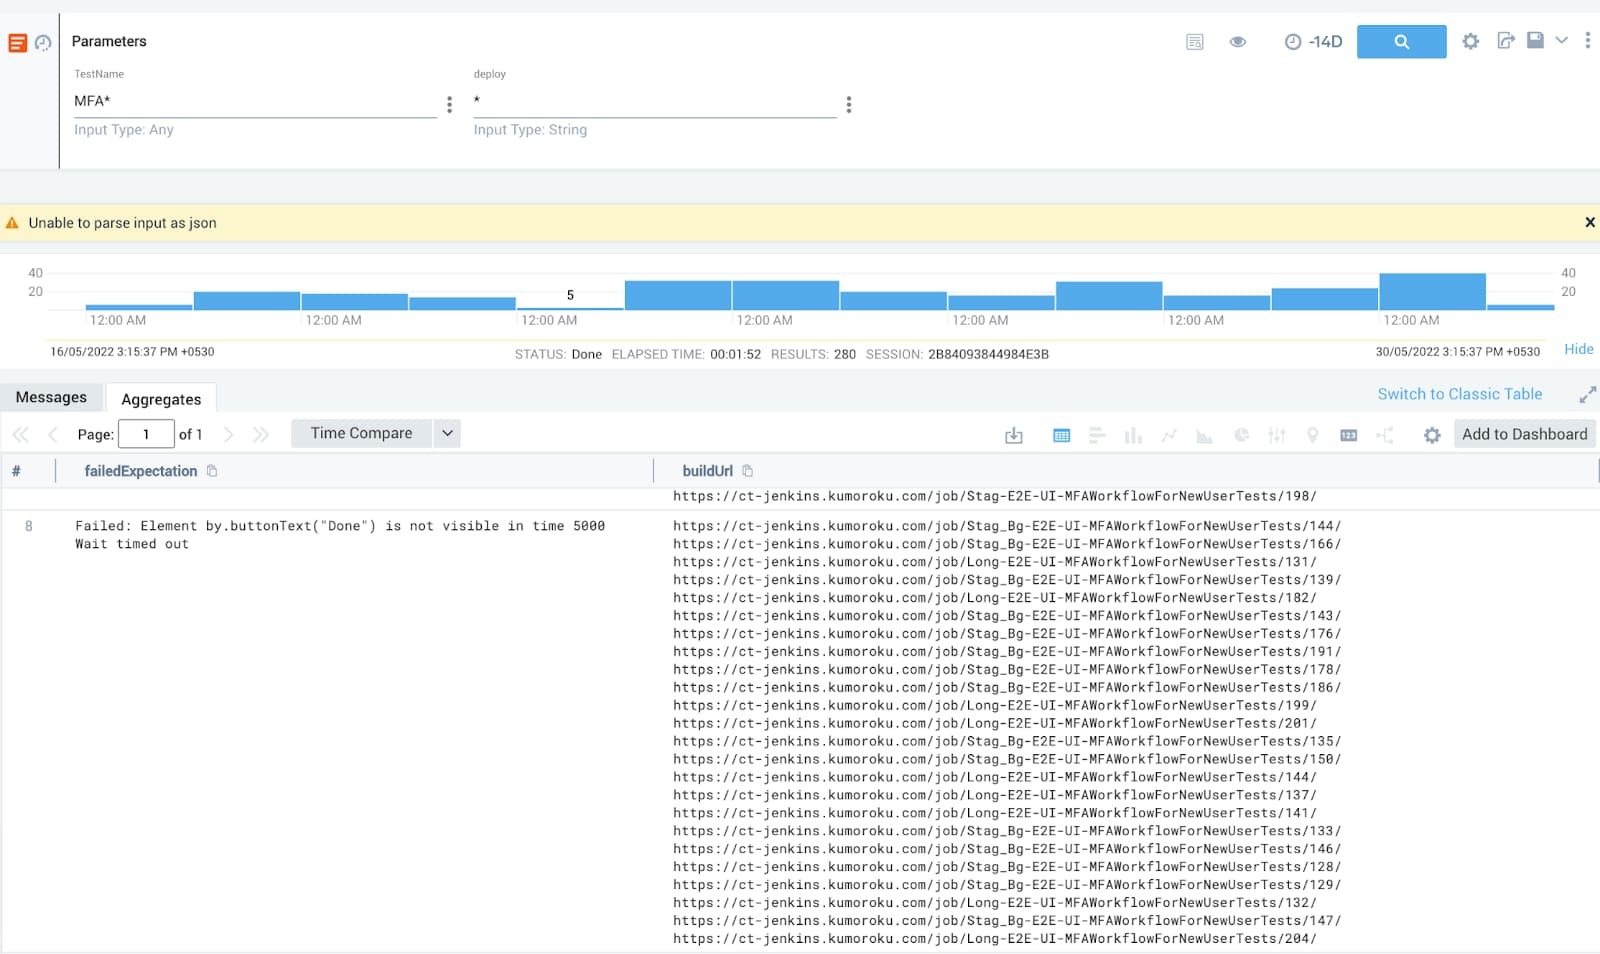
You can solve this using the transactionize operator with merge to capture instances of common failures and get a quick view over a large time range to decide if this qualifies as a pattern of failures.
With Search Templates, it is easy to pick and choose and make the whole workflow intuitive and easy to onboard new users.
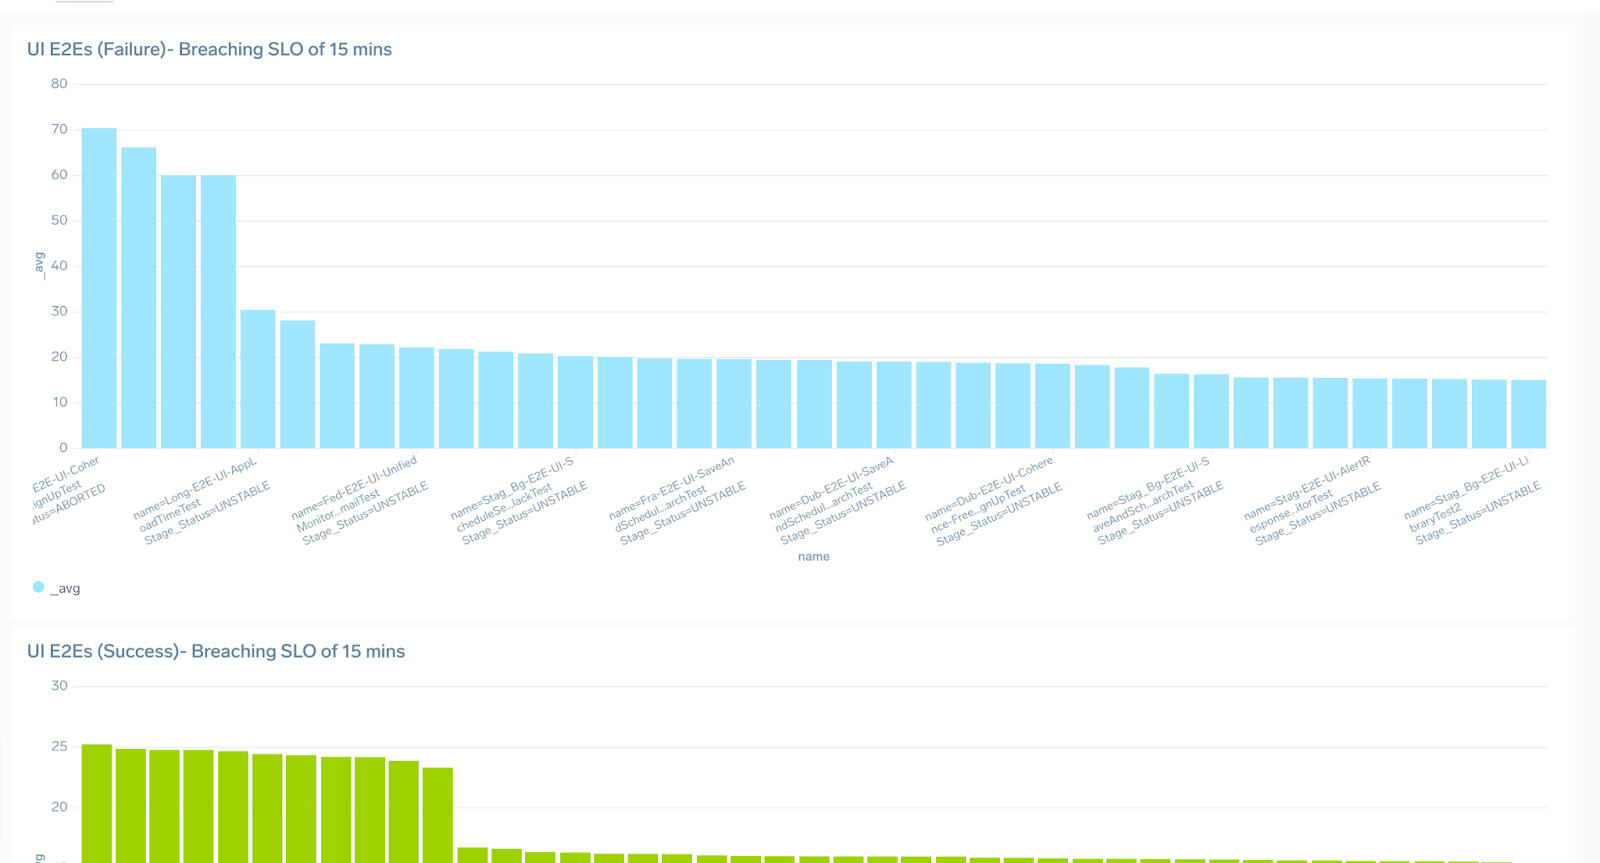
With a growing product, it is common to overlook the time your tests have started to consume. While it may indicate degraded performance (which can be measured separately), more often the problem is a bloated test suite slowing down your pipeline.
It is easy to record stage duration on automation frameworks like Jenkins, and visualize data for individual jobs. But consolidating this data in one place saves precious time and helps teams take action faster and earlier. With this information in hand, you can split the test suites into multiple parallel workflows that reduce the overall time to validate a build in staging or production.
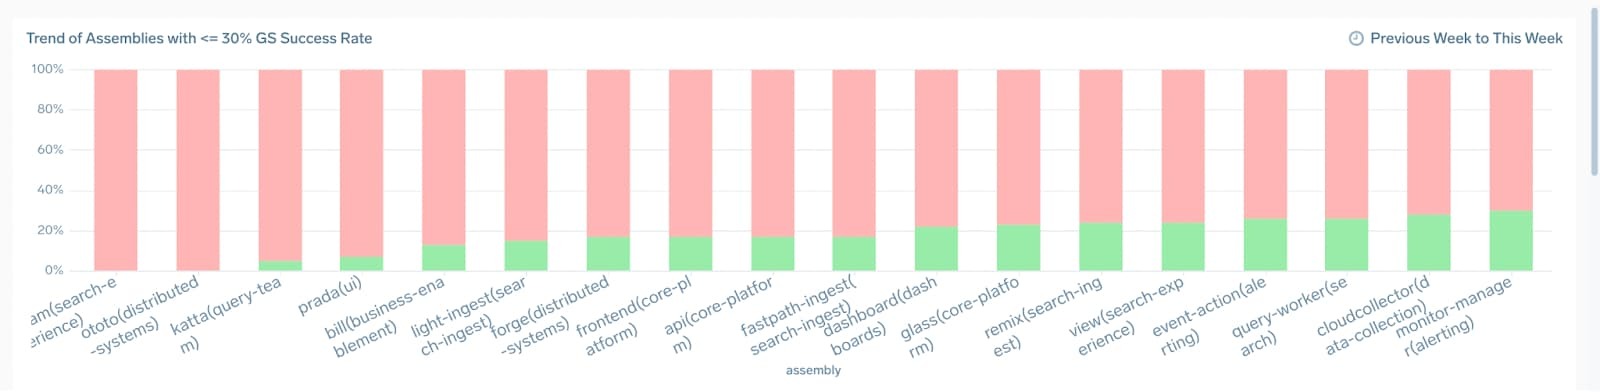
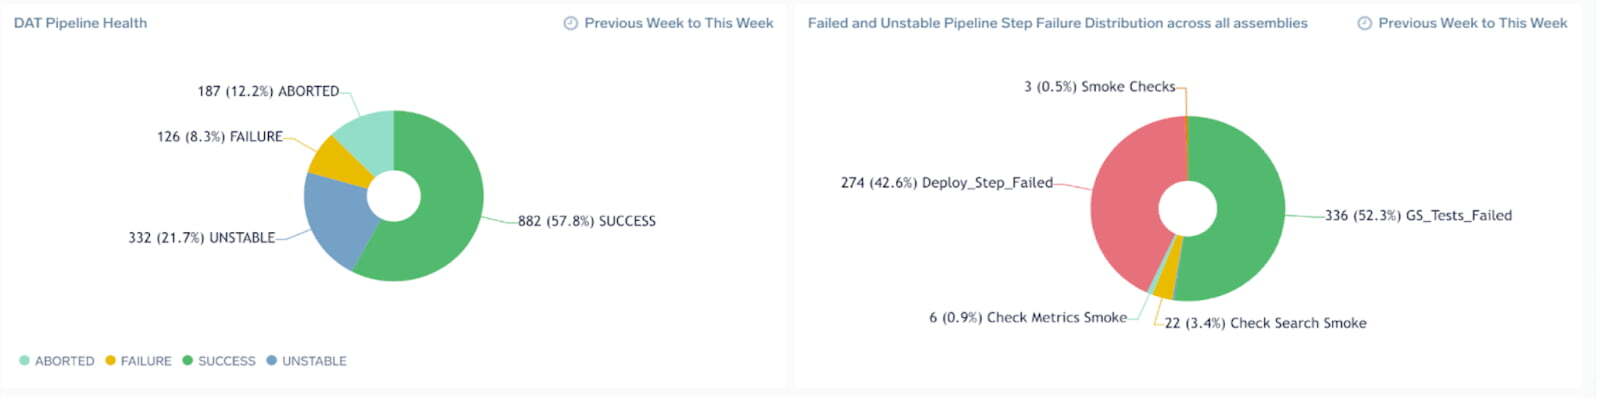
Validating new assembly versions successfully and frequently is critical to improve your service DORA metrics. Chasing an elite DORA status amplifies the need to monitor staging deployments, reduce failures in the pipeline and regularly observe and call out trends. You can set up dashboards on some critical metrics from the CI/CD pipeline to regularly report which assemblies have a low success rate and why.
Having the ability to observe the data from different angles makes it easier for the DevOps team and the engineering team to collaborate and target problematic areas. It is a direct insight into the quality of the builds and a more holistic picture than only looking at test success rates.
We measure assembly success using the frequency of “gold stars”, a best practice that you can use. A gold-star version (GS version) is a version which is successfully deployed and tested through Unit, Integration and End-to-End Tests. Assemblies that get more frequent gold stars are considered healthier as they are able to deploy more frequently to production.
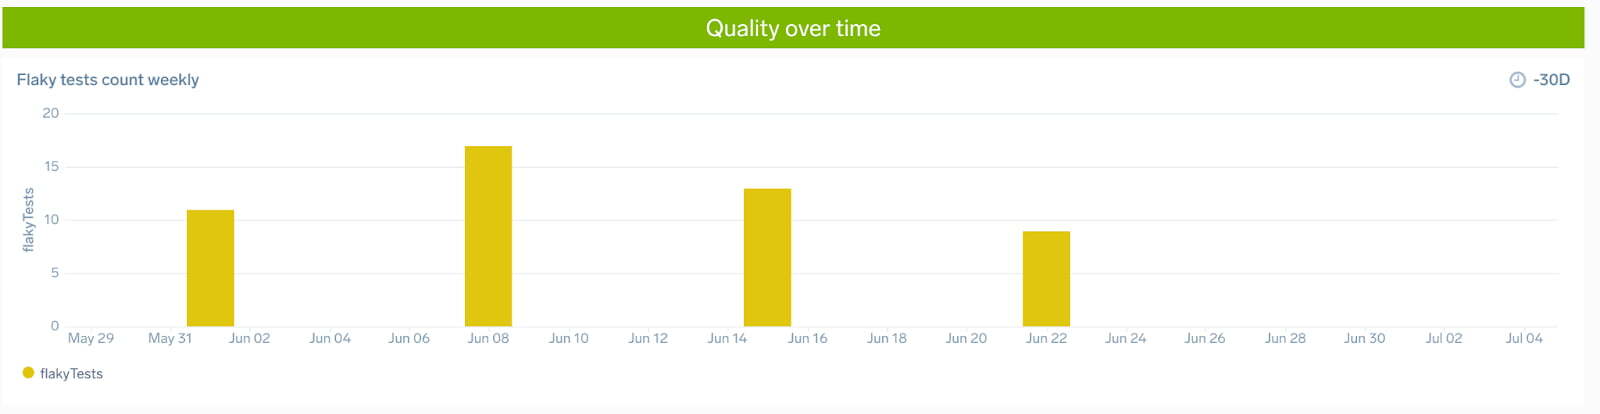
In addition to this, we regularly monitor our flaky tests by modules. It helps us identify feature areas that have inefficient automation. It is crucial to identify these modules for context and mobilize teams to take action in these areas based on the severity of the situation.
As your company grows, having a plethora of complex automation is inevitable. It becomes necessary to account for historical trends and establish a correlation between tests that are always green and tests that are always red.
It is likely that the infrastructure will be over-provisioned to run tests that provide no real insight into system health and are always green (even during outages!). On the flip side, there may be tests that fail so often that they are likely to be ignored by your on-call. They create too much noise and operational overhead for fixing the script.
For newer features that need fine-tuning for load and scale, it is necessary to have end-to-end monitoring on all deployments. But after a while, when the tests are stable and all major feature versions are deployed in production it may need some reconsideration.
Pruning the suite with the help of this data can help speed up your deployments and provide more room for new and more critical workflows to get added to your test suite.
Tracking your automated testing across a variety of microservices and deployments isn’t easy. Being able to look at data and trends will help you focus directly on the problem in minimal time.
Your QE team can leverage a variety of Sumo capabilities like dashboards, search operators and monitors to find repeat offenders among test failures. This allows the team to have meaningful discussions around the stability of the product as well as figure out any operational gaps.
There is a saying that goes something like “Whatever gets measured gets managed”. Identifying and measuring your KPIs consistently can help you make the right decisions, and making that data accessible will speed up the process of decision making.
Test observability applies the concepts of observability to the QE use case. While it is not the only tool in the box, it is definitely one of the more useful ones.
Read more about the Sumo Logic platform and how it can enhance your observability.
Reduce downtime and move from reactive to proactive monitoring.
Build, run, and secure modern applications and cloud infrastructures.
Start free trial
Software Engineer II
Ayushi is a data nerd, always looking for trends and patterns, going down data rabbit holes over random ideas she uncovers during the day. She enjoys creating new intuitive automations and workflows to free up even more time for such exploration.
Outside of work, she enjoys discovering new books and music, falling down more creative rabbit holes.
More posts by Ayushi Asthana.

No credit card required. Up and running in minutes.
More than 2,100 enterprises around the world rely on Sumo Logic to build, run, and secure their modern applications and cloud infrastructures.
