Organizations building modern applications are adopting technologies like Docker as a way to build applications from small independently deployable microservices that communicate through lightweight RESTful APIs. In a DevOps context, containers allow agile teams to templatize application execution environments that developers can use and operations teams can “bless” for production deployment.
DevOps teams are challenged with monitoring, tracking and troubleshooting issues in a context where each container emits its own logging data. There are numerous methods for gathering logs and events data from Docker containers, and services may not agree. If a logging method fails, even temporarily, that data is lost.
Technical Challenges
Microservice teams typically employ machine data analytics to log and monitor each individual service, utilizing dashboards to check up/down status, other operational metrics and performance-related KPIs. The challenges are:
- Each container emits its own logging data
- There are numerous methods for gathering logs, stats and events data from containers
- Containers may not agree on a common method
- If a logging method fails, even temporarily, that data is lost
Once log data has been acquired, assembling meaningful metrics such as the condition of your host environment, the number of running containers, CPU usage, memory consumption and network performance can be arduous. The challenges are:
- Logs and events not stored in one uniform place; may be scattered in a variety of different isolated containers.
- Synchronizing with log platforms that have specific dependencies (e.g., requires Java or Node.js)
- Developers may have to parse and format different data depending on the log source.
- Container security
Solutions
Sumo Logic delivers a comprehensive strategy for monitoring Docker infrastructure with a native collection source for events, stats, configurations and logs. The Sumo Logic application for Docker utilizes Sumo Logic’s advanced machine-learning and analytics capabilities to enable DevOps teams to analyze, troubleshoot, and perform root cause analysis of issues surfacing from distributed container-based applications and Docker containers themselves.
The Sumo Logic App for Docker provides out-of-the box dashboards, reports, saved searches, and field extraction rules for popular data sources. The app uses a container that includes a collector and a script source to gather statistics and events from the Docker Remote API on each host. Pre-built dashboards allow you to view statistics for your container environment, along with CPU, memory, and network performance. The app also provides visibility into container events such as start, stop, and other important commands.
Why Sumo Logic?
Sumo Logic is the only cloud native service to provide both log analytics and time-series based metrics to give you real-time, continuous intelligence across the entire application lifecycle and stack. Log analytics provides the forensic data you need, and time-series based metrics give you insights into the real-time changes taking place under the hood. To understand both the health of your deployment and the behavior/experience of your customers, you need to gather machine data from all of its sources, then apply both logs and metrics to give teams from engineering to marketing the insights they need.
Collect and Centralize – Sumo Logic can effortlessly collect terabytes of data from any app, cloud, device, custom hardware, sensor, server and network sources. Lightweight collectors collect, compress, cache and encrypt the data for secure transfer. Centralized logging eliminates the need for additional archiving, backups and restores.
Search and Analyze – Administrators can run searches and correlate events in real-time across the entire application stack using an easy-to-use search engine-like syntax. The patent-pending LogReduce™ technology reduces hundreds of thousands of Docker log events into groups of patterns significantly slashing MTTI. Transaction Analytics automates processes for collection and analysis of transactional context to decrease time associated with compiling and applying intelligence across your distributed systems.
Detect and Predict – When rules are not enough, the Anomaly Detection technology powered by machine-learning algorithms detects deviations to uncover the unknowns in your data. Also powered by a unique algorithm, Outlier Detection analyzes thousands of data streams with a single query, determines baselines and identifies outliers in real-time giving DevOps and Security teams visibility into critical Key Performance Indicators (KPIs). The Predictive Analytics capability extends these capabilities by projecting future KPI violations and helps ward off impending issues.
Monitor and Visualize – Custom dashboards and visualization help you easily monitor your data in real-time. The dashboards, available in light or dark themes, contain a collection of real-time monitors and unify all data streams so you can keep an eye on events that matter.
Alert and Notify – Custom alerts proactively notify you when specific events are identified across the stack. The patent-pending Push Analytics technology leverages LogReduce to establish a baseline of application, system, and infrastructure activity. Proactive notifications are generated when your data deviates from calculated baselines or exceed thresholds to help you address potential issues promptly.
Sumo Logic App for Docker
In addition to easy collection of container and application log data, the Sumo Logic App for Docker includes dashboards providing critical information about your entire Docker container environment including overviews of the containers in your environment, and overviews for your CPU, memory, and network performance.
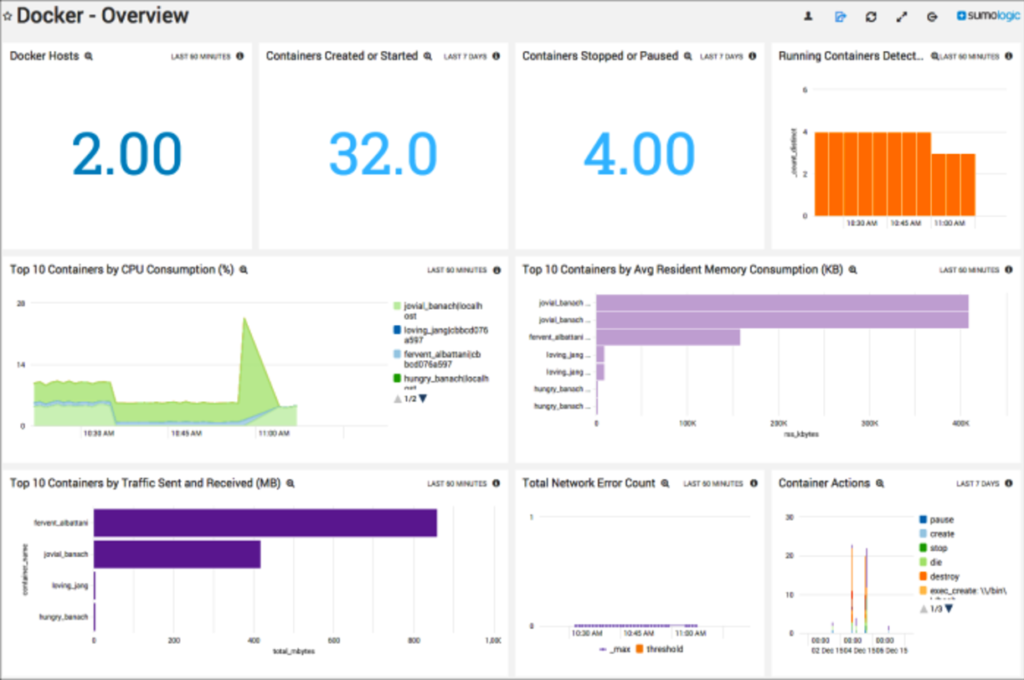
- Base Images for Running Containers in the last hour
- Docker Hosts - number of Docker hosts for the last hour
- Containers Created and Containers Detected
- Top Containers by CPU Consumption, Average Resident Memory Consumption, and Traffic Sent and Received
- Total Network Error Count for the last hour
- Container Actions for the last seven days
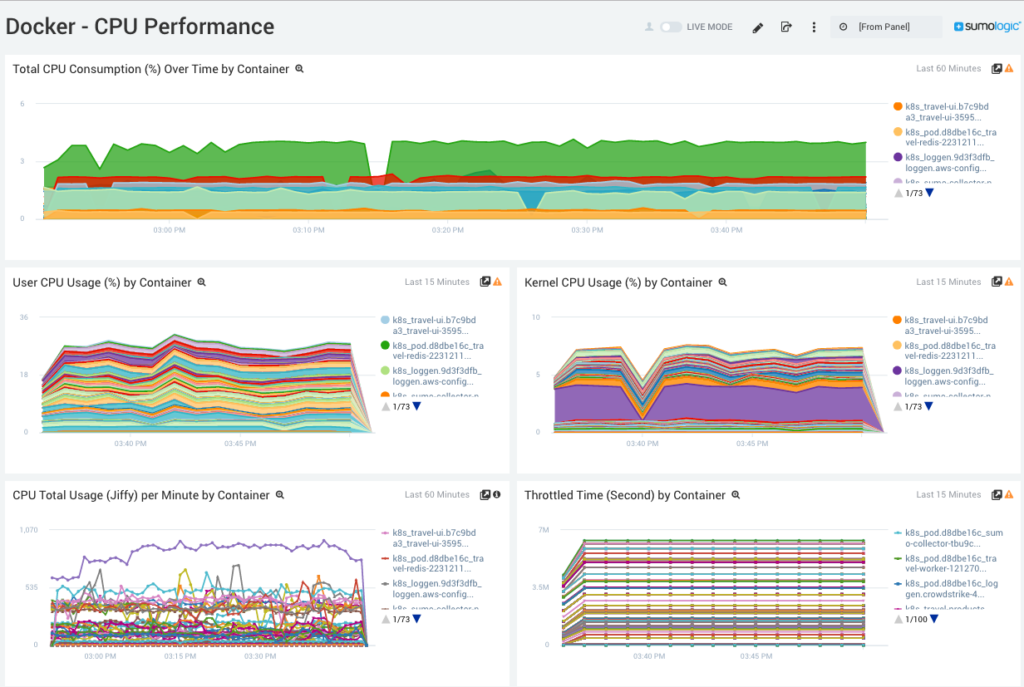
CPU Performance
In addition, Docker App allows you to drill down on CPU Performance, memory performance and network performance:
- Total CPU Consumption Over Time by Container
- User CPU Usage by Container
- Kernel CPU Usage by Container
- CPU Total Usage (Jiffy) per Minute by Container
- Throttled Time (Second) by Container
Memory Performance
- Top Containers by RSS Memory (KB) Over Time.
- Page Fault Increment per Minute by Container
- Total Page Fault Increment
- Unevictable Memory Increment by Container
- Major Fault Total Count by Container
- Swap Size by Container
Network Performance
- Sent/received Traffic by Container
- Sent/received Packets by Container
- Send/receive Errors by Container
- Total Network Error Count
More than 1,200 customers around the globe rely on Sumo Logic for the analytics and insights to build, run and secure their modern applications and cloud infrastructures. With Sumo Logic, customers gain a multi-tenant, service-model advantage to accelerate their shift to continuous innovation, increasing competitive advantage, business value and growth.
Go to
sumologic.com/application/docker to learn more.


