
2022 Gartner® Magic Quadrant™ SIEM
Get the report
MoreTrusted by thousands of customers globally.
Browse our library of ebooks, briefs, reports, case studies, webinars & more.
September 29, 2021
Imagine you are an on-call engineer, who receives an alert at 3 AM in the morning informing you that customers are experiencing high latency on your website, and are unable to shop. Being an Incident response coordinator myself at Sumo Logic, I can tell you, I don’t envy being that engineer.
If this alert fired, this is what would likely follow:
Has this alert fired in the past? If yes, how often?
How bad is the latency that customers are experiencing?
Is a specific set of customers experiencing it or all customers experiencing the issue?
The biggest challenge is how to gather this information quickly, so you can decide whether to jump out of the bed or go back to sleep.
Someone needs to have created those dashboards in the first place.
The dashboards must be easily located/discoverable. If you are using multiple observability tools, that can be difficult, or confusing.
Likely, your team has a specific way of tagging and organizing the information within those tools. You’ll have to navigate that as well.
Now I am not saying that dashboards are bad, but this manual process overly taxes the on-call engineer by forcing them to select the right tools to use, and how to use them as opposed to helping them find and address the critical problem.
Correlating the observed suspects back to the main alert. “Is the connection timeout on service X related to the high latency that customers are experiencing?” If yes, how? This requires tribal knowledge, system understanding, and the ability to connect the dots. Now, this is a tall order even during the daytime (when your wits are still with you). You need to have tons of experience to do it effectively.
You would need to find evidence that either proves or disproves your hypothesis. If connection timeout on service X is related to the high latency that customers are experiencing, then what data in logs, metrics, or traces I can find that corroborates my hypothesis? This means you need to know how to run ad-hoc queries in your observability tool/(s) to get at the “data behind the dashboards” in order to find the evidence required.
If all of the above was not enough, you are also under pressure to quickly resolve the issue, since your service is essentially down, which is costing your organization $$$$ every minute.
We at Sumo have been thinking a lot about this on-call experience for the last year, and it’s a problem we’re solving with a new capability “Alert Response” which applies our advanced analytics across a unified repository of telemetry data to ease the burden faced by on-call teams in troubleshooting issues.
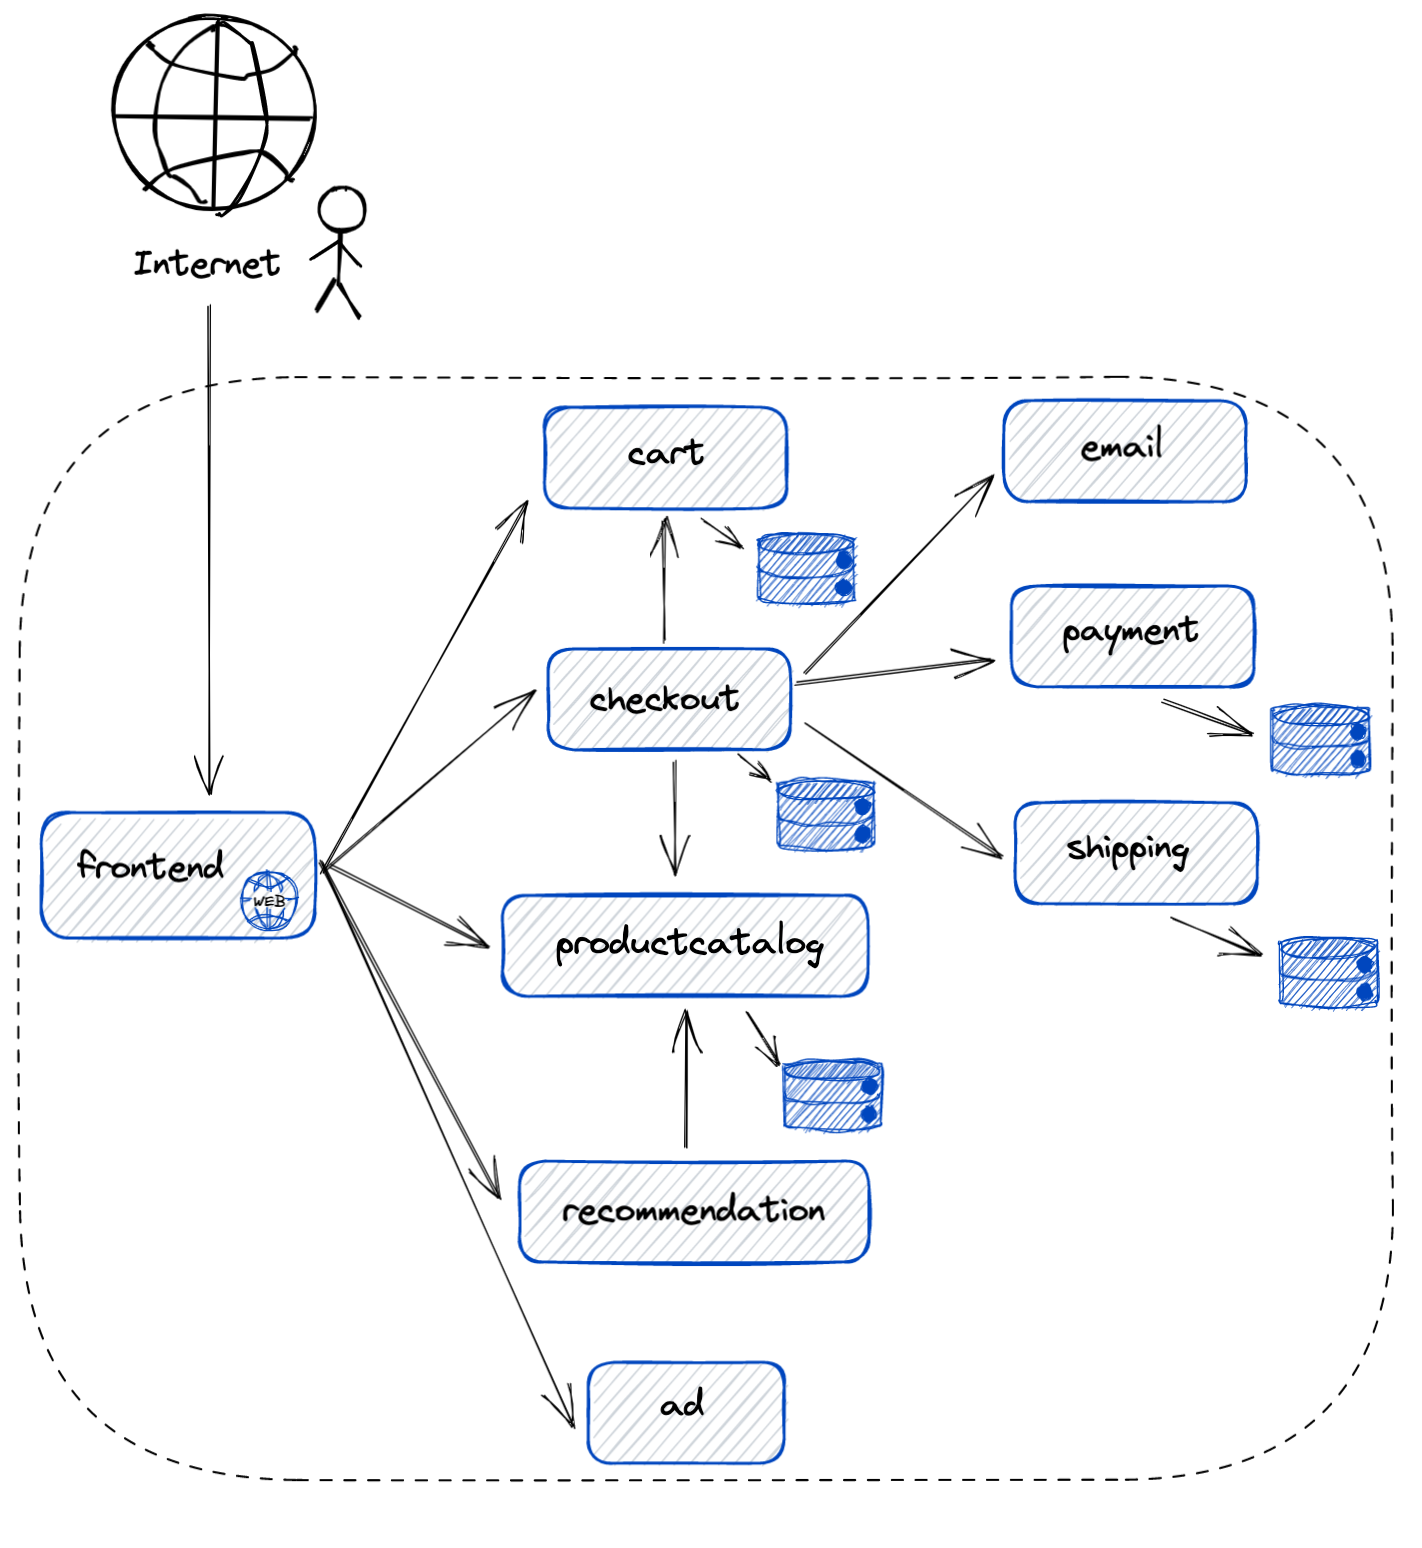
Let’s see how Alert Response, can help improve the troubleshooting experience described above, with an example. In this example, we will walk through an outage scenario on an online boutique store that sells vintage collectible items. There is something wrong with the website, and as a result, customers are experiencing errors when trying to shop. A high-level overview of the application is provided below
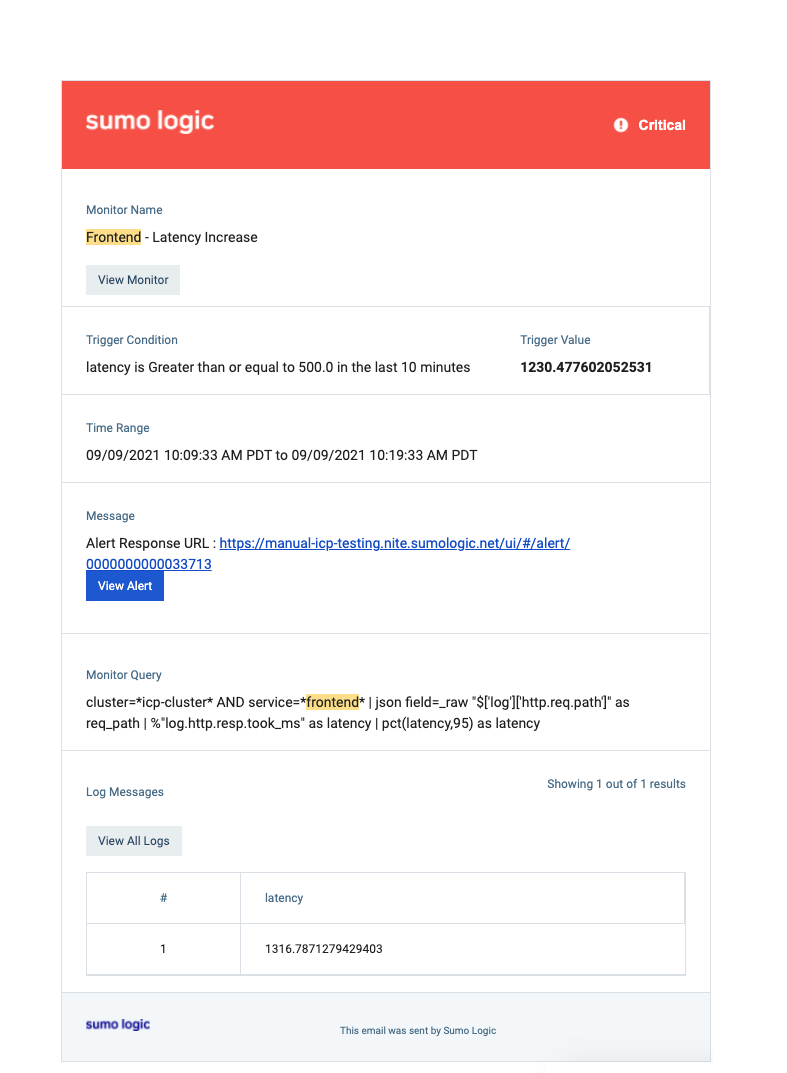
We again start the journey with an alert that informs the on-call engineer about the high error rate on the website. The alert will contain a link to the Alert page within Sumo Logic.
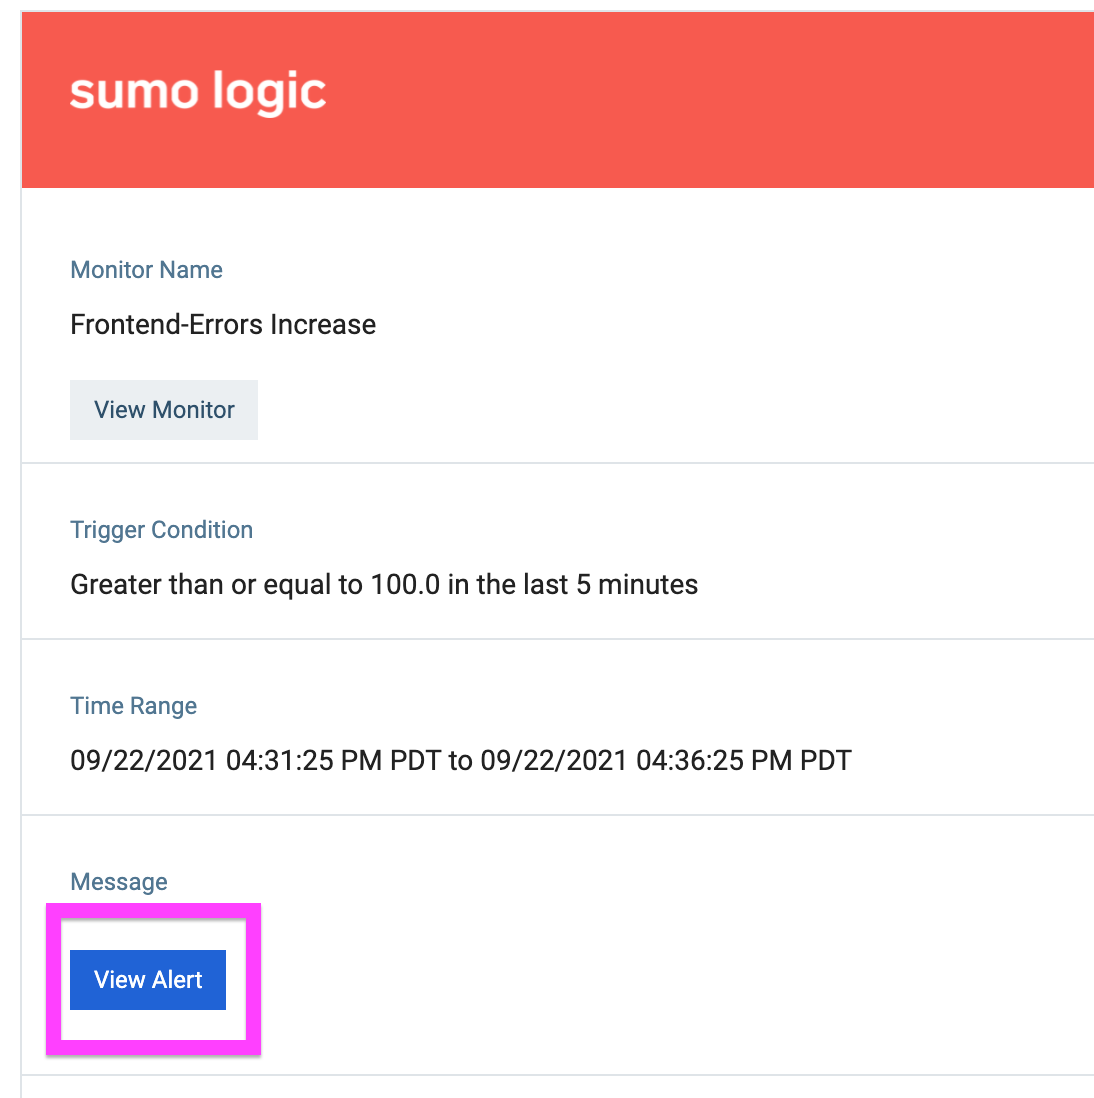
Clicking on the alert, the on-call engineer will land in Sumo on the new Alert page, where he will find more information about the issue. Here he can see from the visualization that errors increased dramatically after this alert was generated, and these errors were almost non-existent before. This provides context around the magnitude and severity of the issue. The page also shows other related alerts that are firing in the system, which suggests that this is not a false alert.
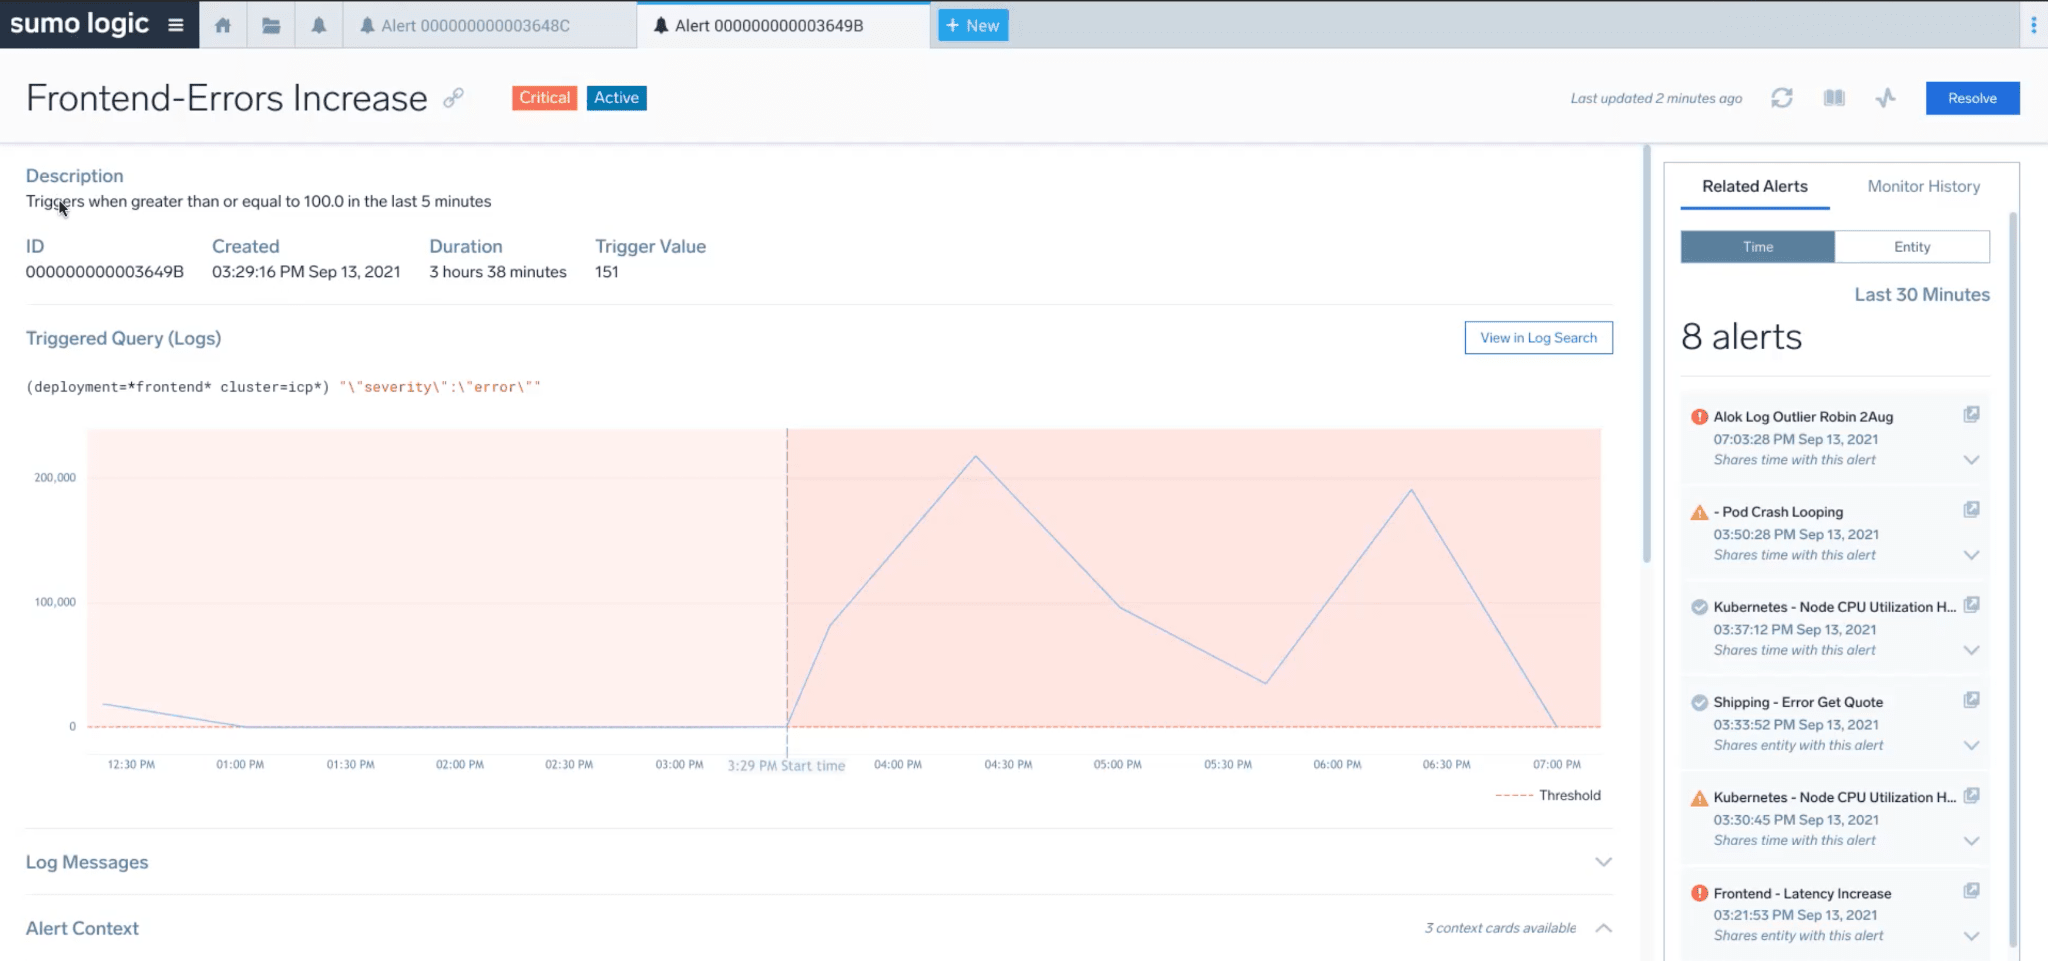
The related alerts section shows that pods are crashing, which might help form the first hypothesis. Maybe pods crashing is causing the underlying issue. On-call would probably want to investigate further, he can do that by clicking on the Alert Drilldown link, but more on this later.
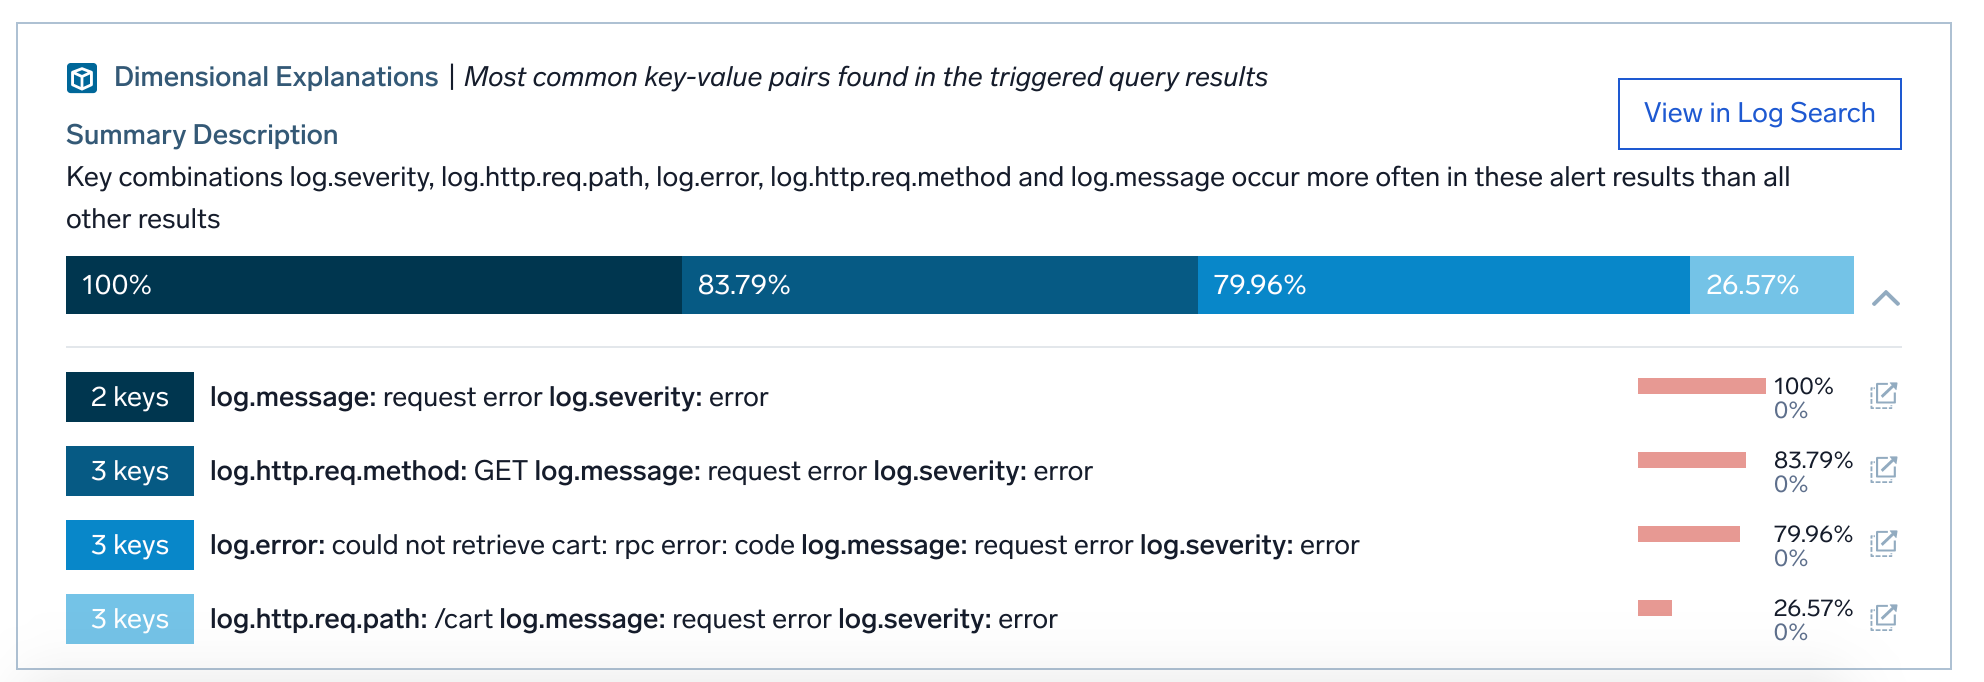
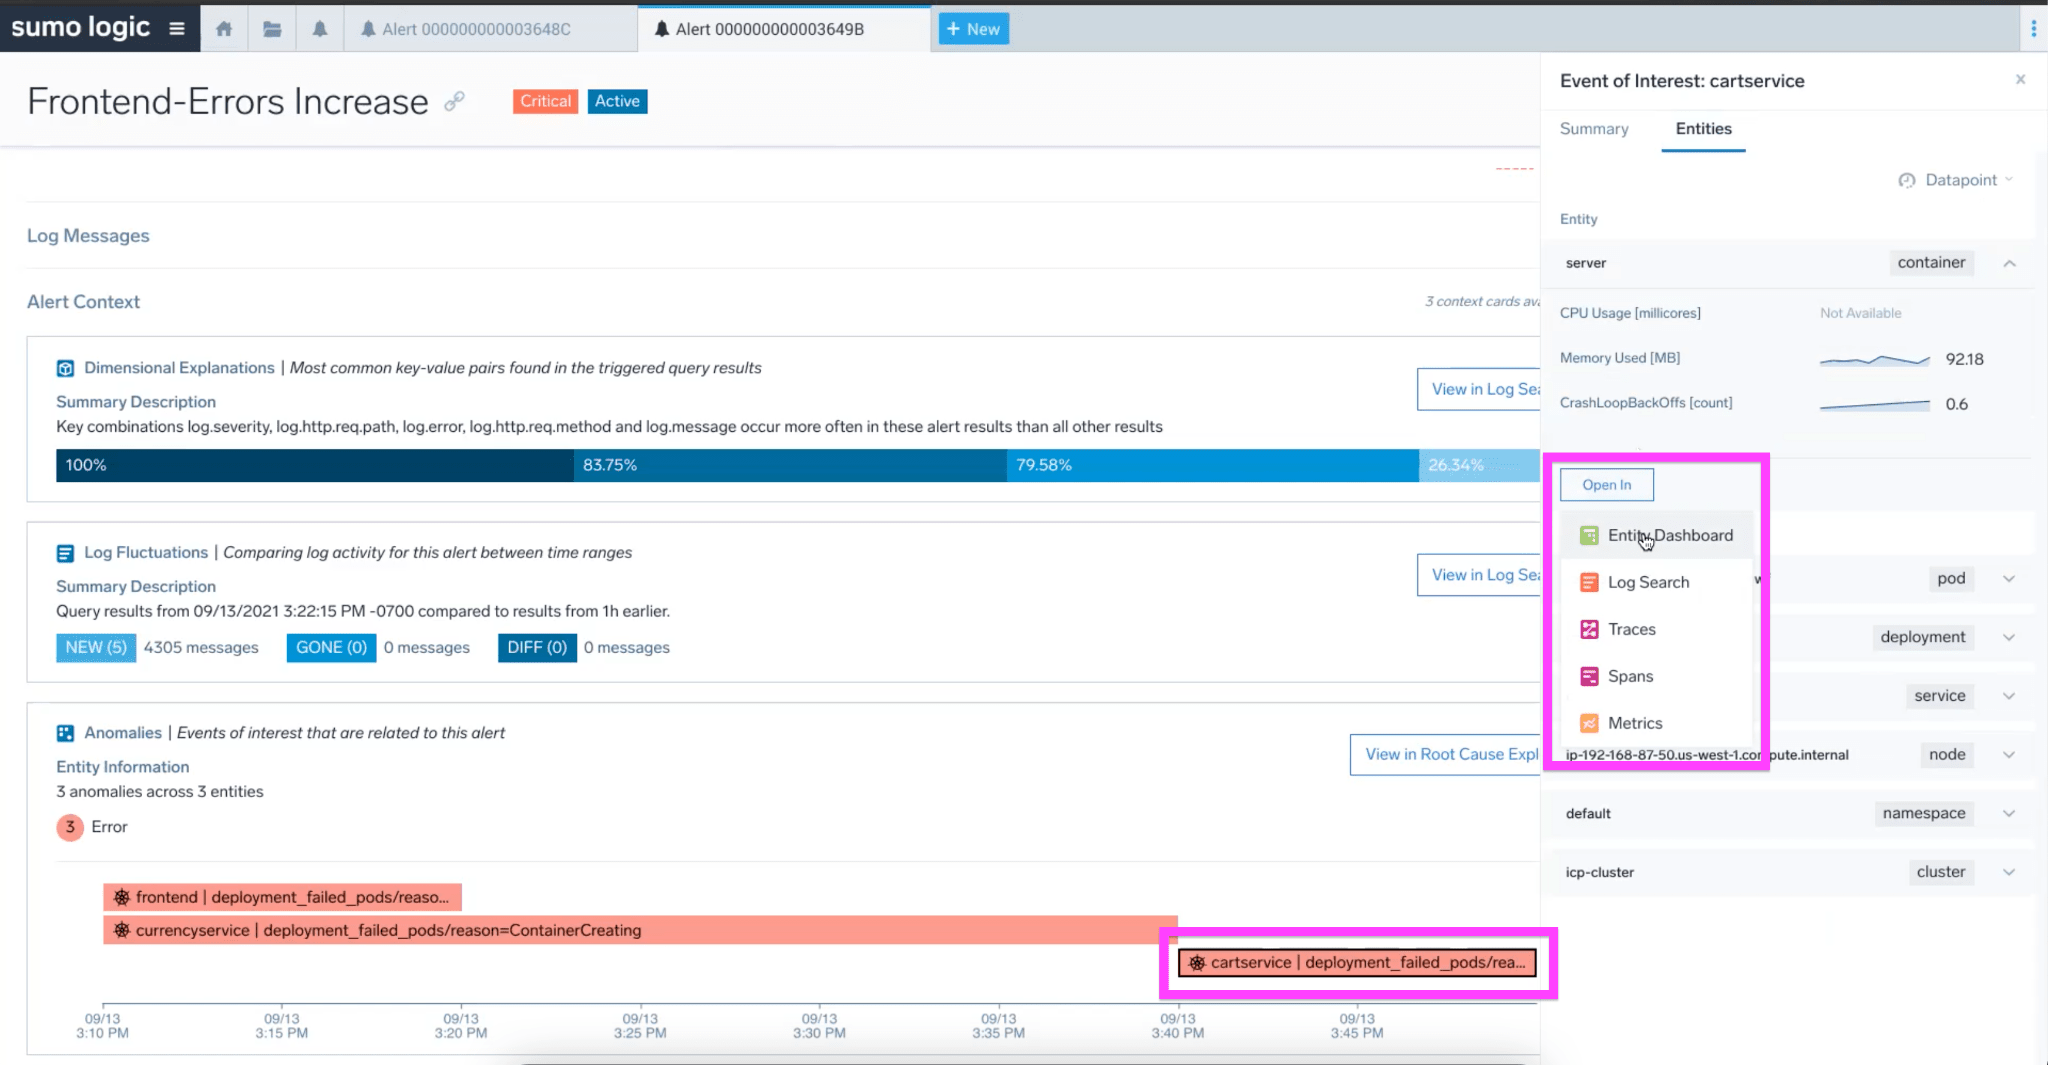
The Alert page has another section called alert context. This section surfaces interesting insights that Sumo Logic has found by automatically analyzing the data (in the background) you send to the platform, to find anomalies/deviations from normal. The information is surfaced in the form of easy-to-consume cards. For this issue we see three cards.
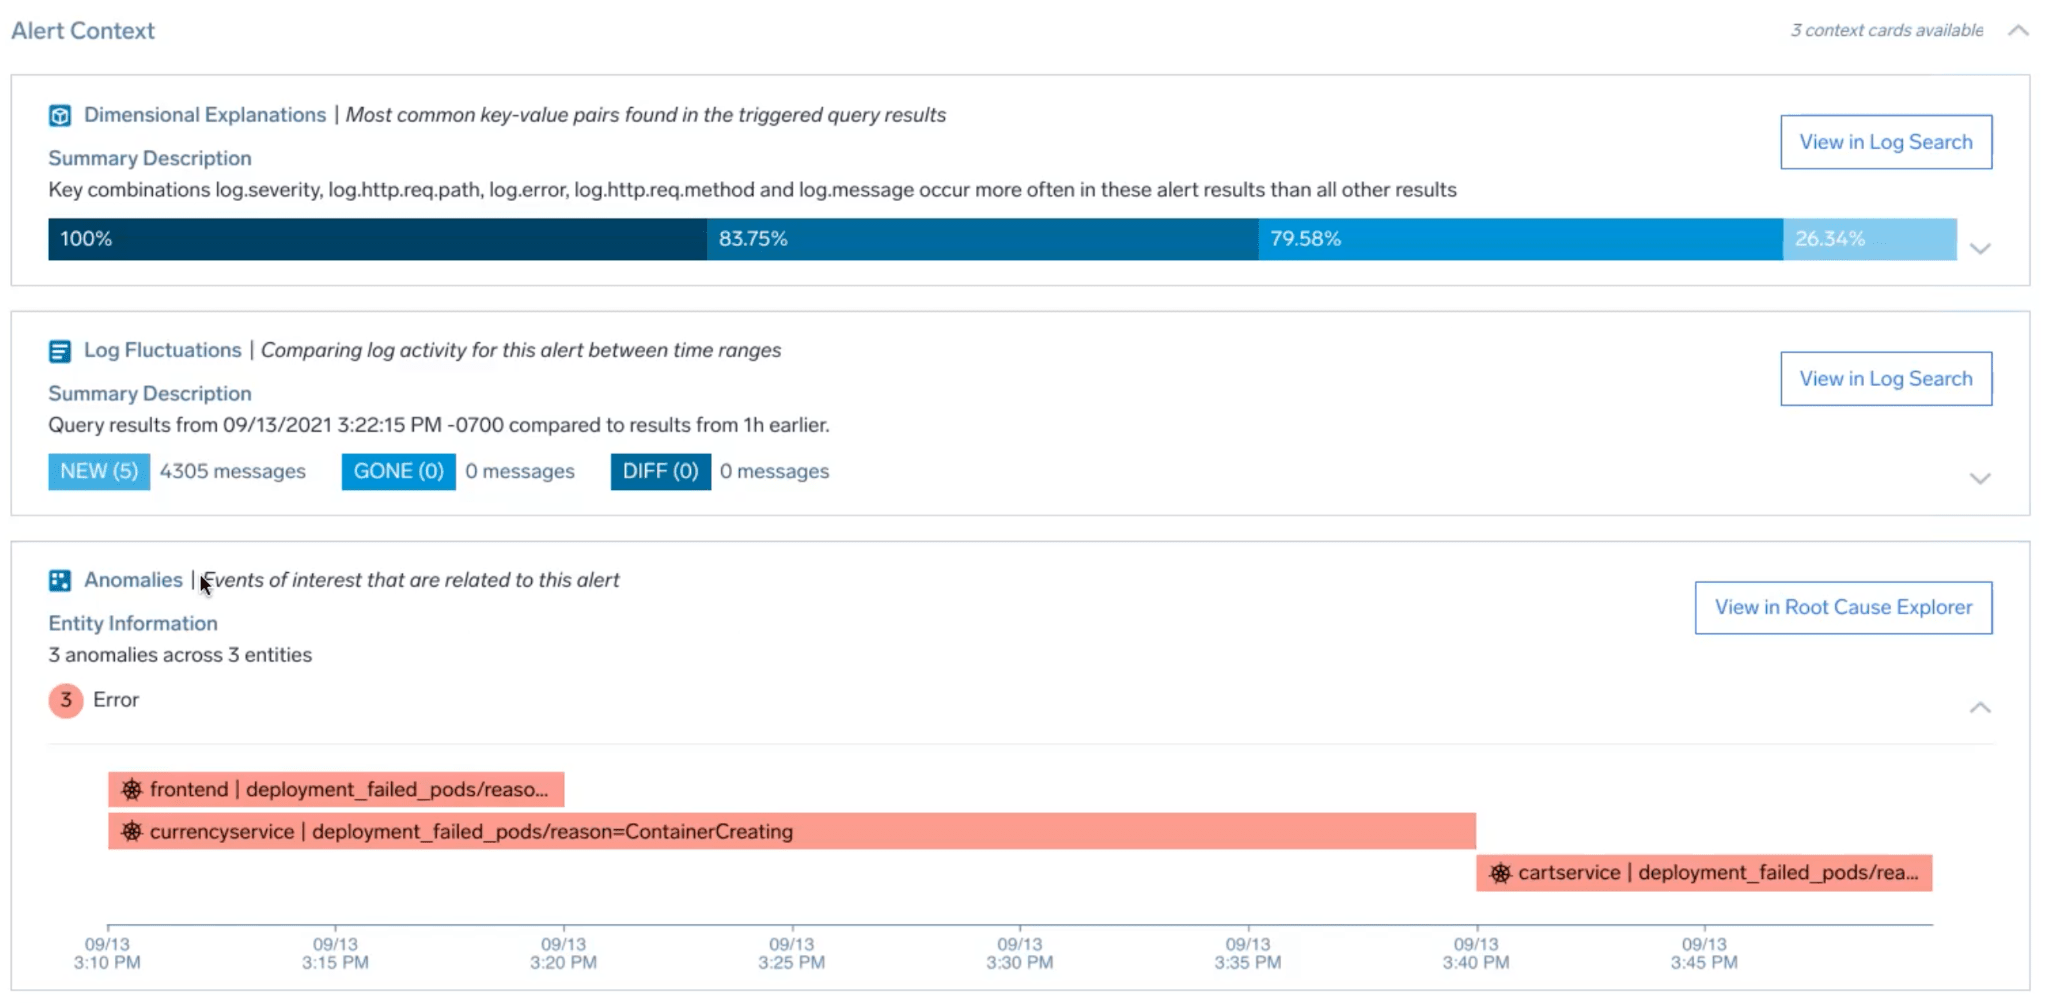
This card analyzes log data and surfaces dimensions/key-value pairs that might help explain the alert. In our case, the card is showing that ~80% of the alert logs have field log.Error =“could not retrieve cart: rpc error: code”, signifying that something is wrong with the cart service. It also provides drill-down links to view the log messages and get more details.
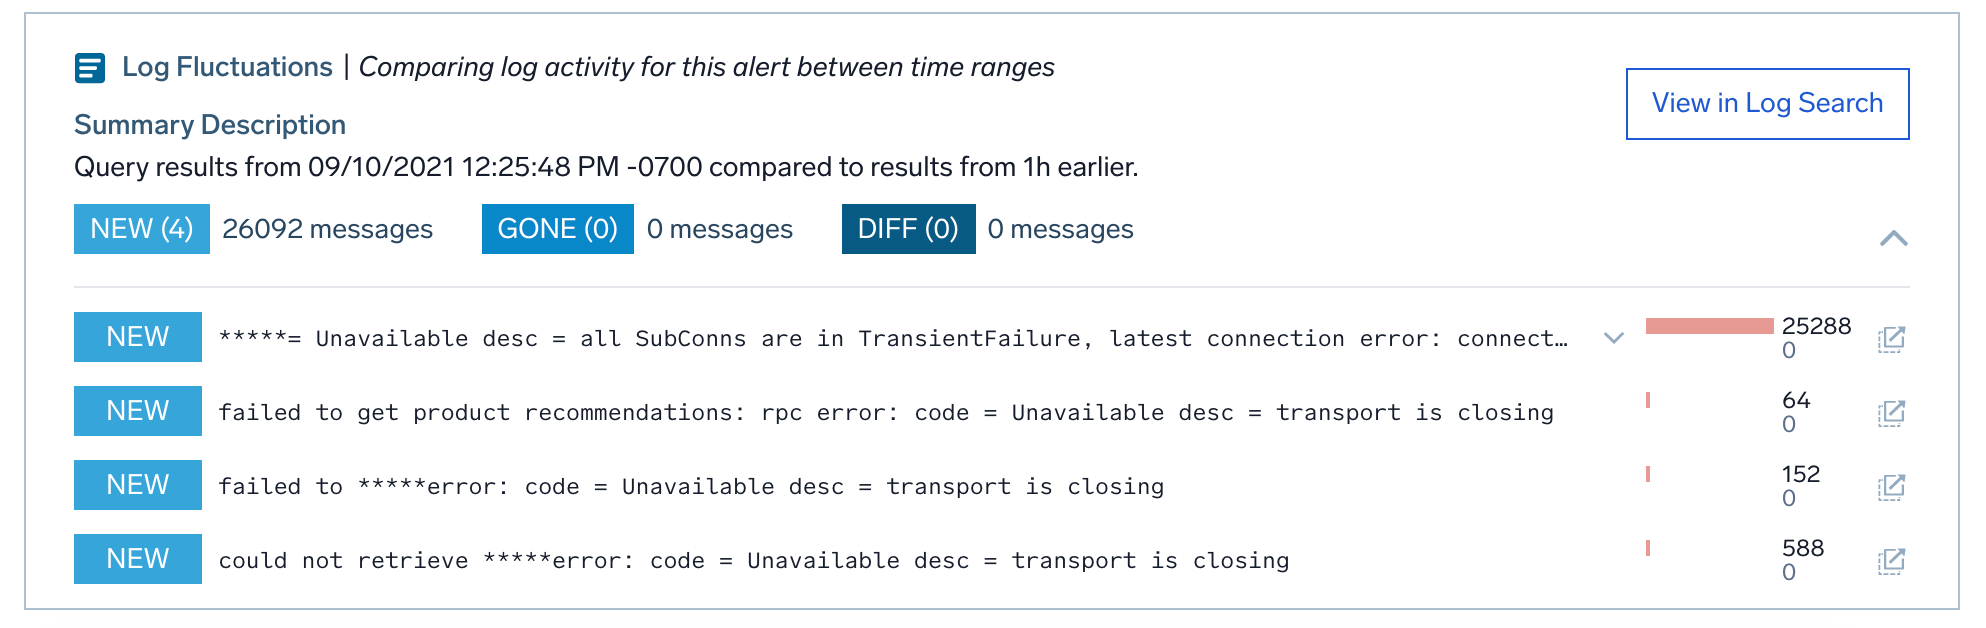
Next up is Log Fluctuation. This card leverages our powerful and patented log reduce to identify changes in log patterns/signatures ( for example error, timeouts, etc.) that might help explain the underlying issue.
In our example, the card has identified a connection failure error signature. These failures all started happening after the alert(252800 log messages match the signature compared to 0 before the alert). Here again, we have drill-down links for further investigation.
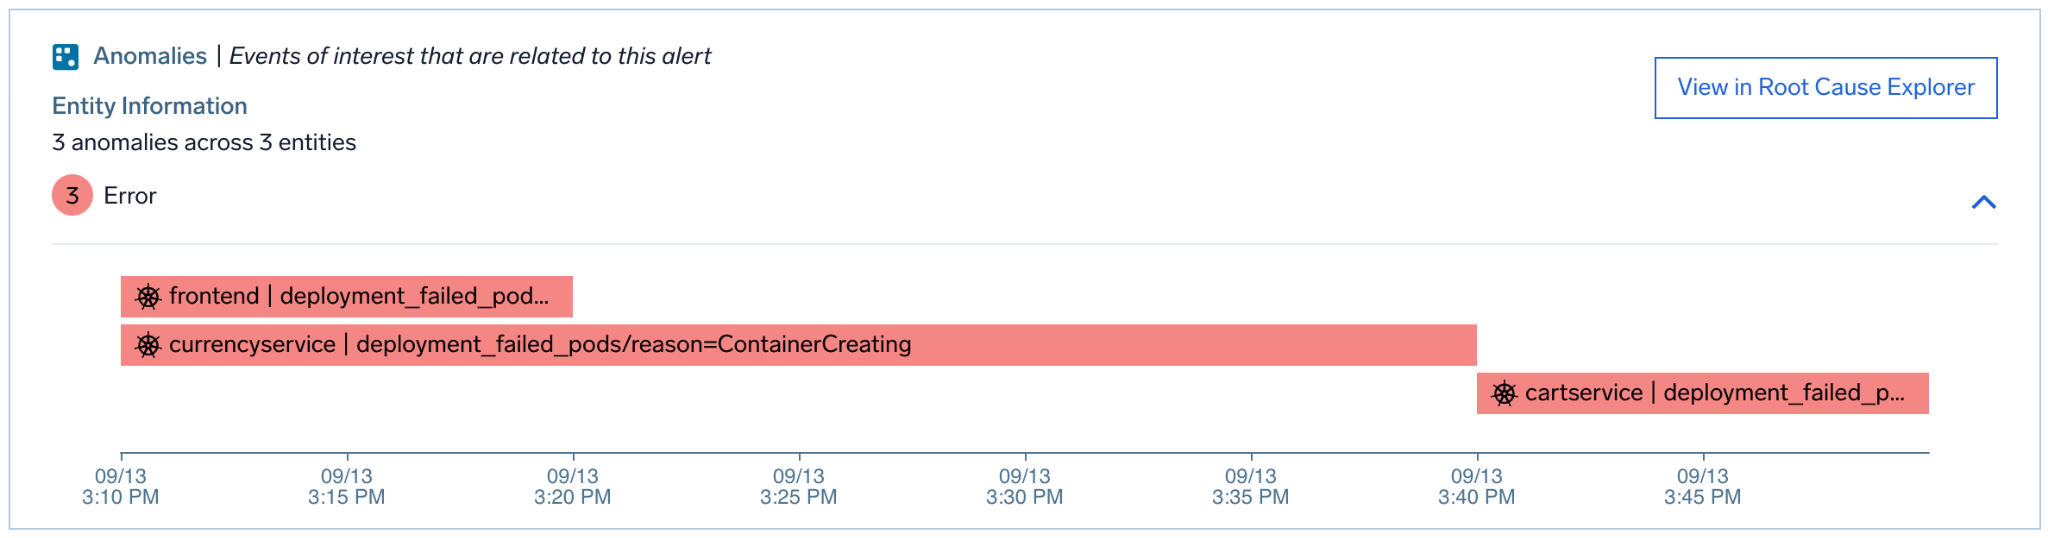
Finally, we have the Anomaly card, which as the name suggests, finds anomalies in metrics data over time on various entities that our analytics tell us are, most likely related to the alert.
Here the card shows pod failures in a bunch of different services one of them being cart service again.
From the above three cards, the on-call can establish
There are some application failures (Log errors) happening in communicating with the Cart service.
He can also correlate that with infrastructure issues (pod failure) happening on the cart-service
Both these pieces of information together provide him with a smoking gun.
Now to validate the hypothesis, the on-call can leverage various drill-down buttons or he can interact with visualizations on the page directly.
In our example, on-call can click on an anomaly, drill down to the entity dashboard, in this case CartService, to understand what’s happening.
Here he finds that CPU and memory pressure on the service, which explains pod crashes. He can, at this point, provision more resources to fix the CPU and memory, which would solve the problem.
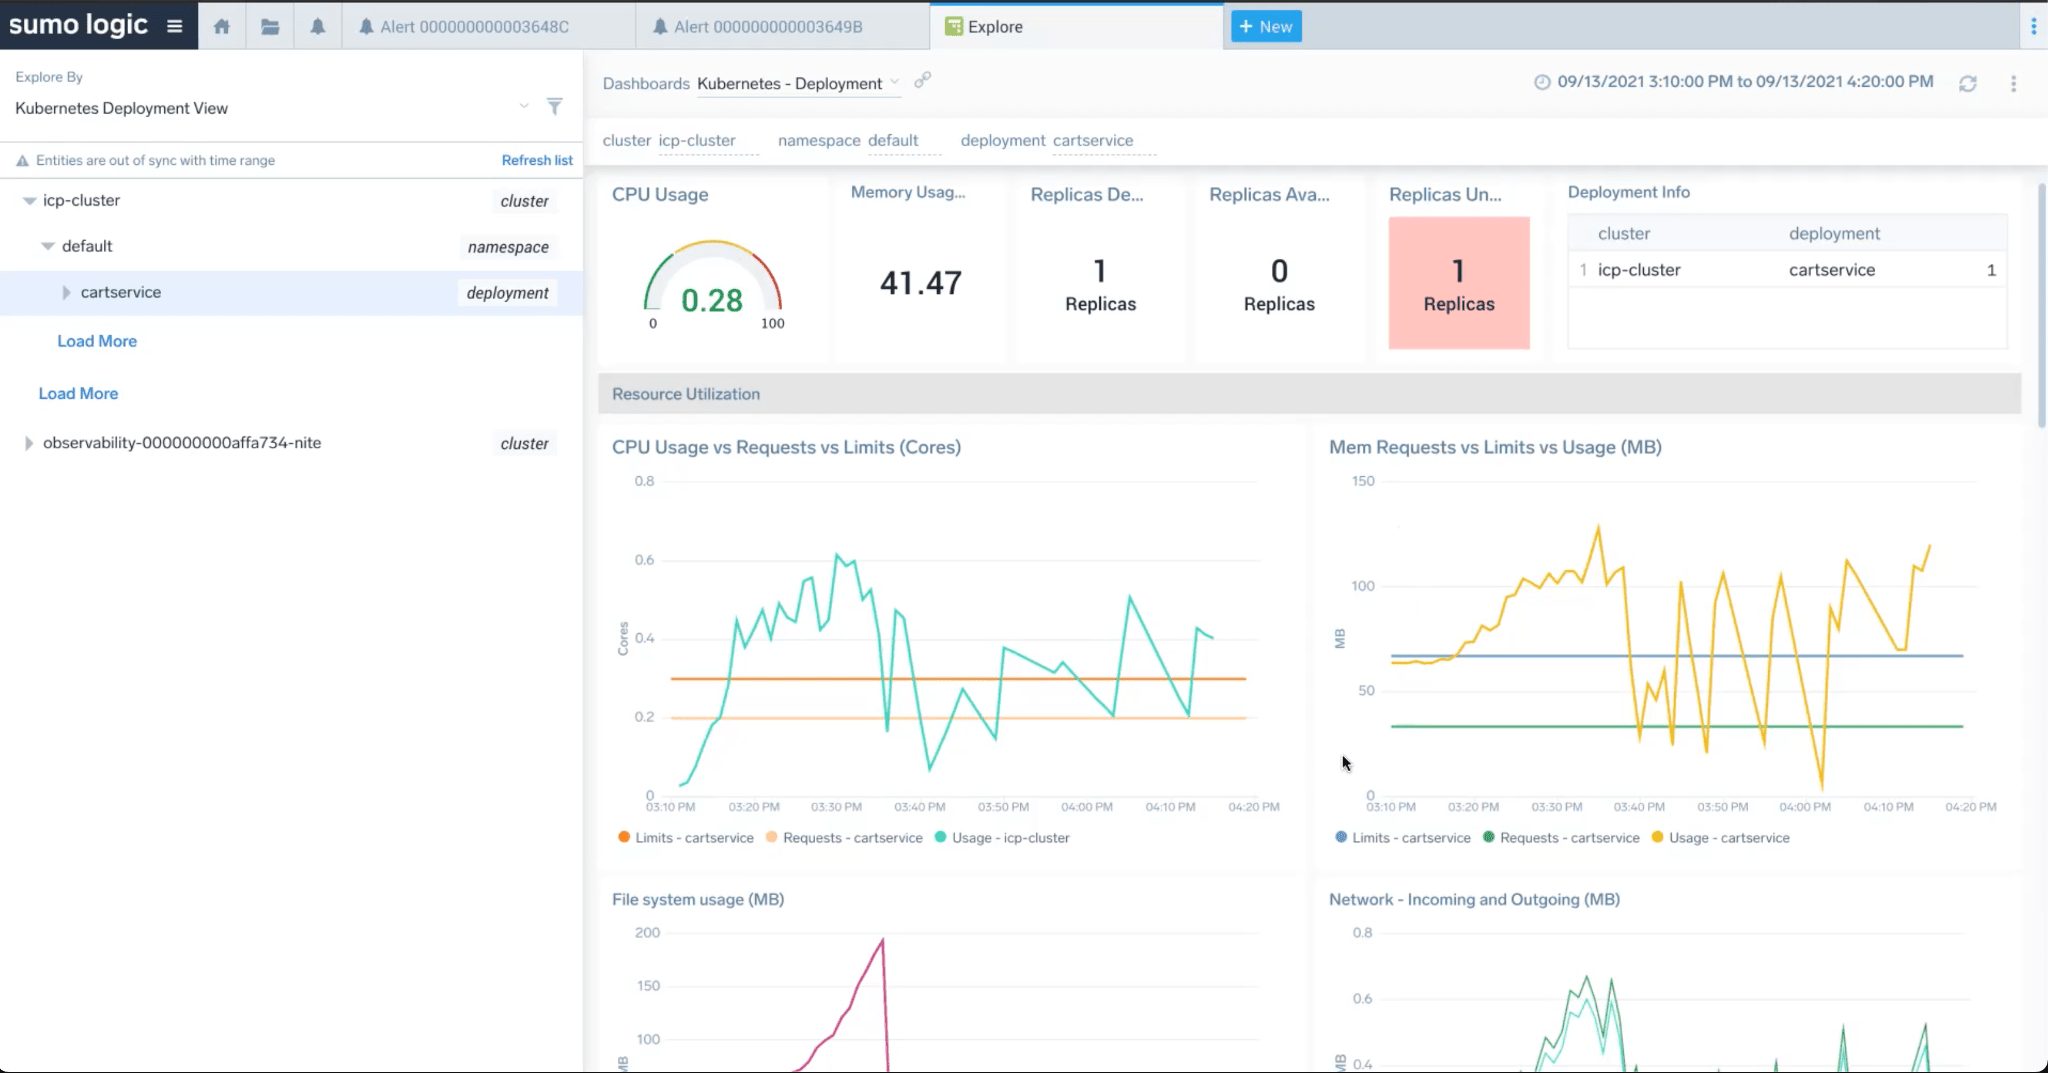
Let’s look at all these steps together in the end-to-end Demo.
As you can see, Alert Response helps observers and on-call engineers by simplifying the work required to
Monitor - Validate the issue
Diagnose - Identify the suspects
Troubleshoot - Narrow down the suspects to get to the root cause
We hope you enjoy using this new feature, and we welcome any feedback!
Reduce downtime and move from reactive to proactive monitoring.
Build, run, and secure modern applications and cloud infrastructures.
Start free trial
No credit card required. Up and running in minutes.
More than 2,100 enterprises around the world rely on Sumo Logic to build, run, and secure their modern applications and cloud infrastructures.
