Better discoverability lead to faster issue resolution
Simplified navigation from both a service-focused and an infrastructure perspective in order to find and solve issues faster using the Kubernetes mental model
Intuitive dashboards that take advantage of the Kubernetes hierarchies
Simplified navigation from both a service-focused and an infrastructure perspective in order to find and solve issues faster using the Kubernetes mental model
Comprehensive visibility of logs, metrics, and events across the Kubernetes stack, including auto-detection and tagging of data according to the live state of the platform.
End-to-end visibility of runtime kernel threats and Kubernetes audit logs
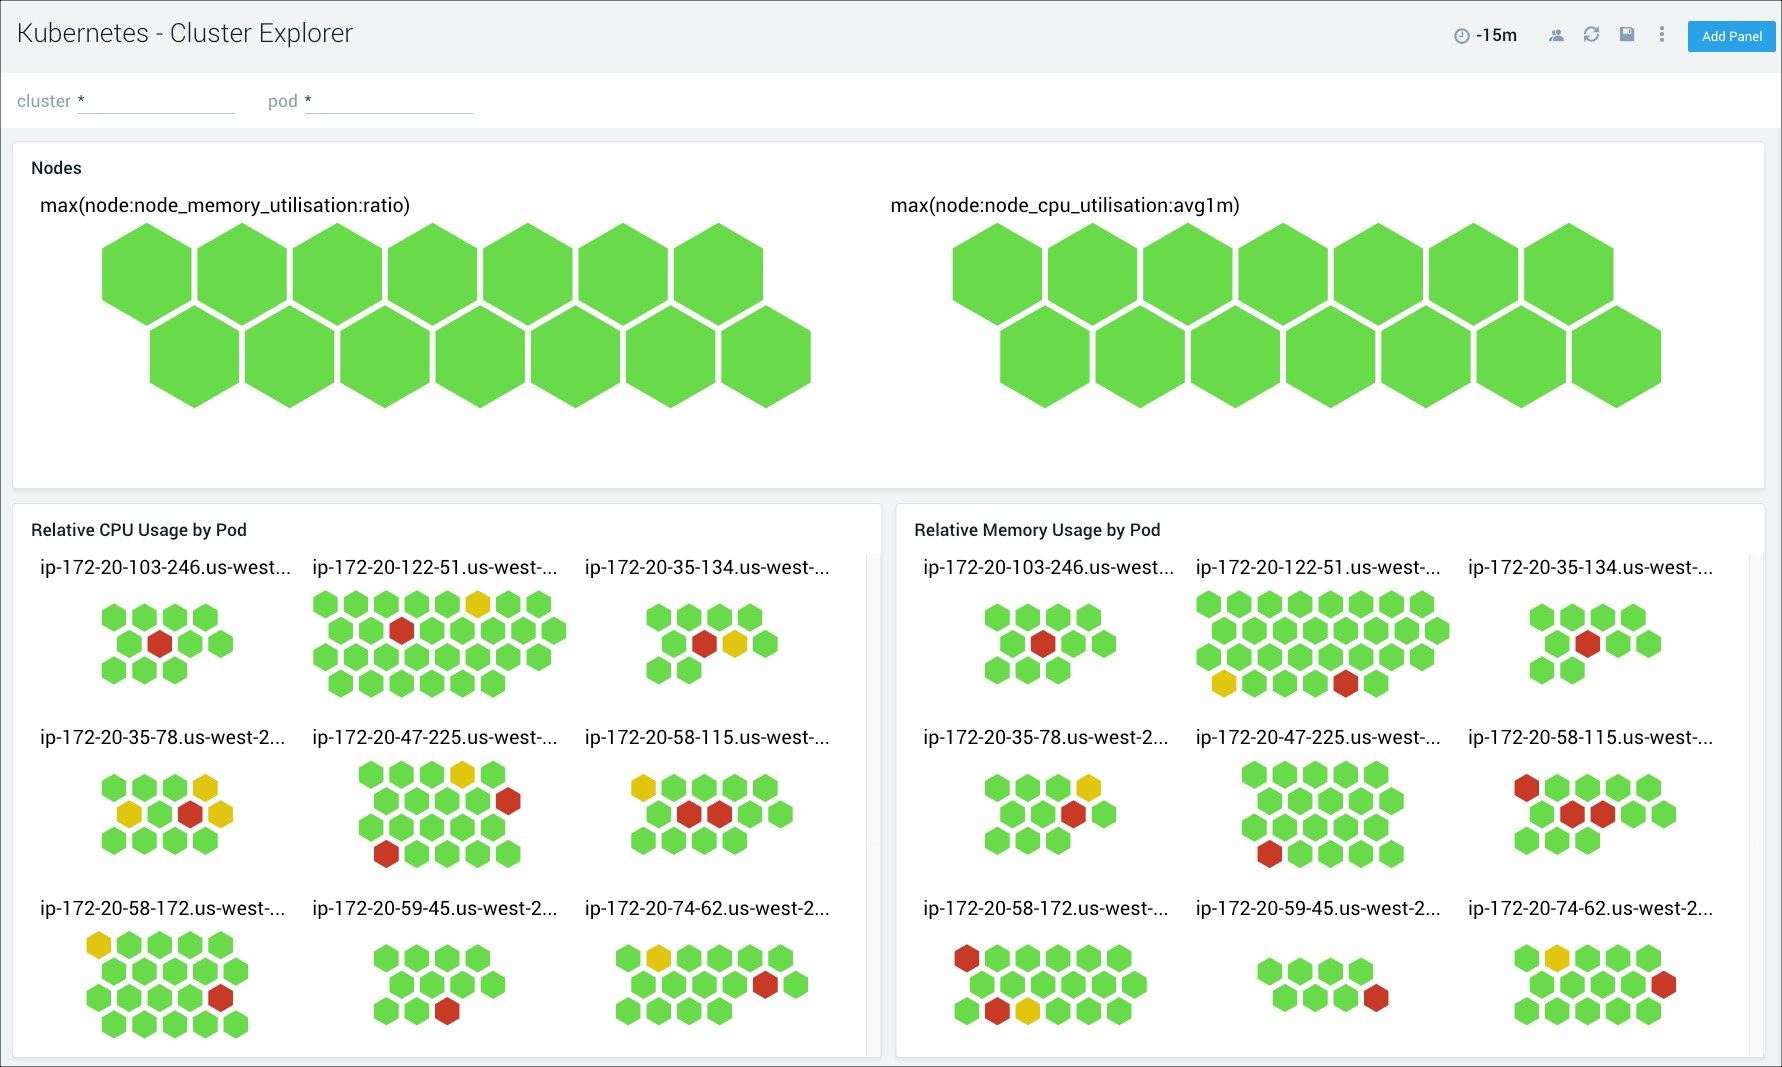
Get instant visibility into cluster health, along with details of all cluster components and resources with an easy to navigate dashboard hierarchy built on the Kubernetes mental model.
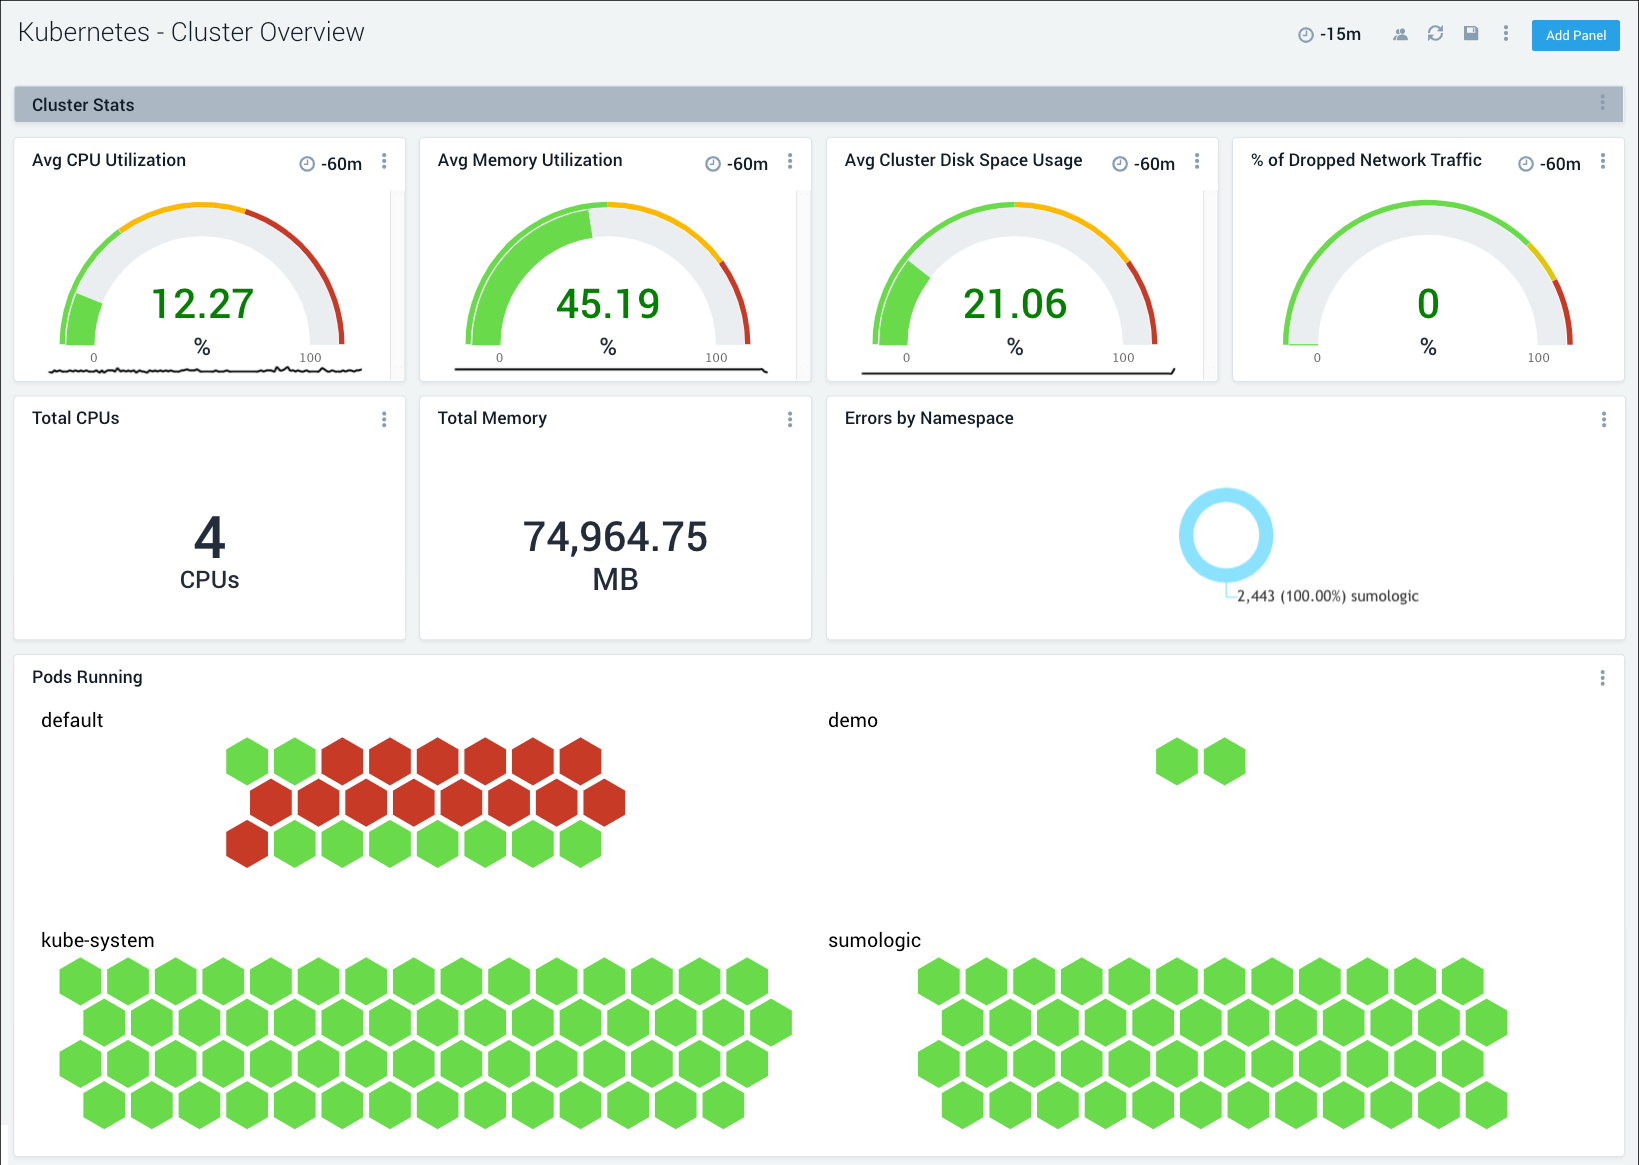
Gain insights into the health of and resource utilization across Kubernetes hierarchies such as pods, deployments, services, containers, nodes, namespaces and daemonsets.
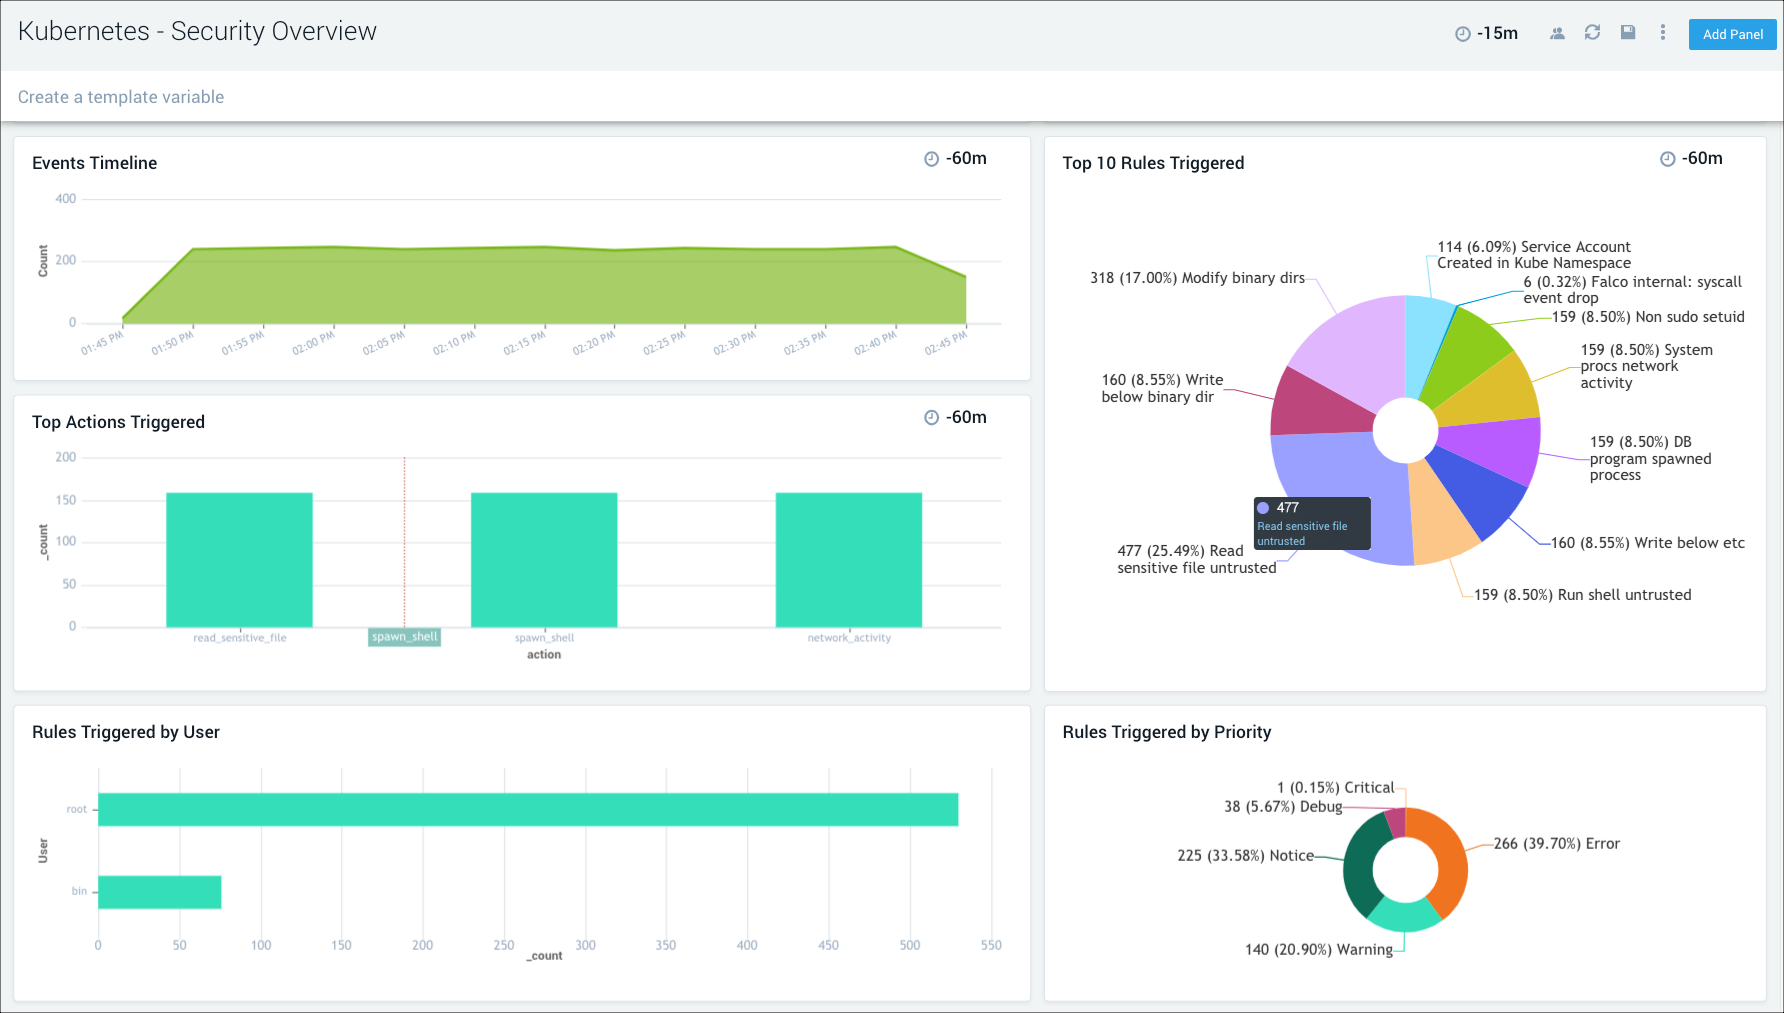
Get insights into anomalous container, application, host, and network activity. Monitor Kubernetes audit events and detect unexpected activity.
Get up and running in minutes. Start your free trial today!

Keine Kreditkarte benötigt. In wenigen Minuten einsatzbereit.
Mehr als 2.100 Unternehmen weltweit verlassen sich bereits auf Sumo Logic, um ihre modernen Anwendungen und Cloud-Infrastrukturen zu erstellen, betreiben und abzusichern.