
2022 Gartner® Magic Quadrant™ SIEM
Get the report
MoreTrusted by thousands of customers globally.
Browse our library of ebooks, briefs, reports, case studies, webinars & more.
September 13, 2022
Just about every organization today relies on key applications running on complex multi-cloud environments to transact business and enable users to work. It is critical to ensure that those applications are running optimally. A solid monitoring and alerting system is required to know when an issue needs attention.
But having a robust monitoring system is not enough. For complex large-scale distributed applications, you also need an easy and effective way to manage and update your monitoring definitions as your applications are ever evolving with each code change and Git commit.
To better relate to this overhead of managing the monitoring system, let’s imagine you are running a distributed web application with just 20 microservices. You need to monitor each of the 20 microservices, so you set up some alert monitors. To keep things simple and reduce alert fatigue you decide to only monitor the four golden metrics: Latency, Error, Traffic & Saturation. You now have 80 alert definitions that you need to manage (20 microservices * 4 alerts per service). Let’s say that you decided to change your boilerplate instrumentation to add or remove some attributes. That change will require you to update all 80 monitor definitions, as there is an underlying change to the data. This is a lot of work.
This overhead in managing the monitoring definitions as applications evolve is a serious pain point that every organization that has alerting in place faces. Sumo Logic addresses this problem for our customers. We want to reduce this management overhead as much as possible.
One of the ways to do it is by reducing the number of monitor definitions that users have to create. What if users in the above example created only four monitor definitions to track the four golden metrics instead of configuring one per microservice? That would significantly reduce the management overhead. This is exactly what our new alert grouping feature does.
This feature allows flexibility in how alerts and notifications are generated from a monitor. There are cases when you would like a monitor to create and resolve more than one alert based on specific conditions. For example, in the above example, you want to monitor the error rate for all microservices, and you want to get an alert for each service separately that breaches a specific error threshold. With alert grouping, you can create one single monitor that does this instead of creating multiple monitors for each service.
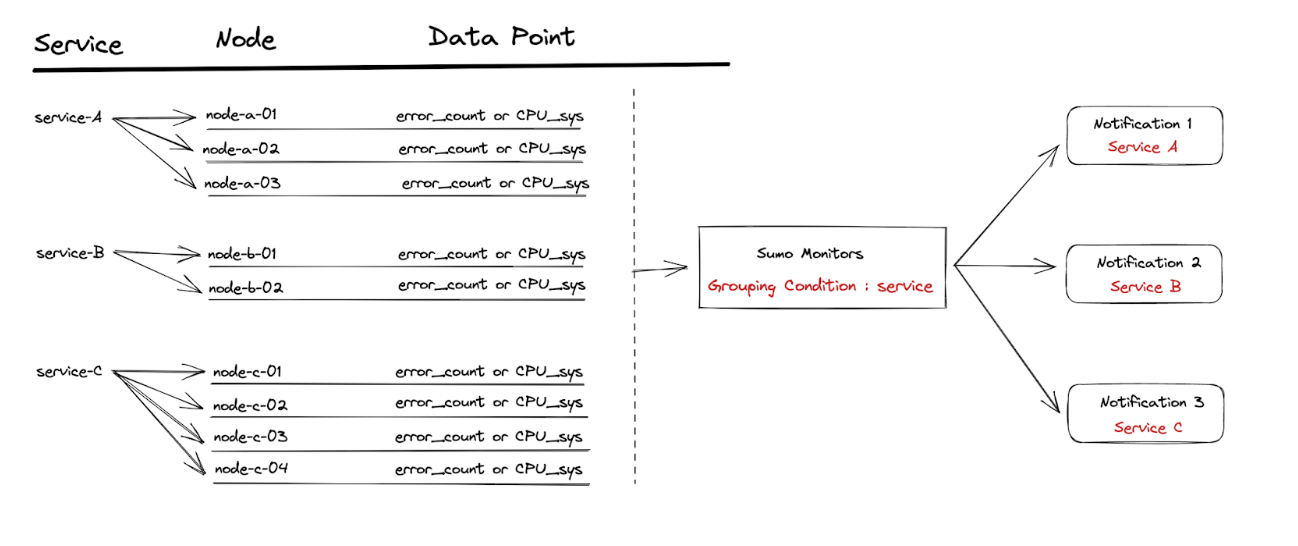
Monitors allow users to specify a grouping condition based on a specific field/(s). Each unique value of the field/(s) will be evaluated against the alerting and resolution conditions, and if it meets the threshold, an alert will be fired and resolved, respectively.
For the example mentioned above, service is the grouping condition, and each service will generate a separate alert if that service meets the alert requirement.
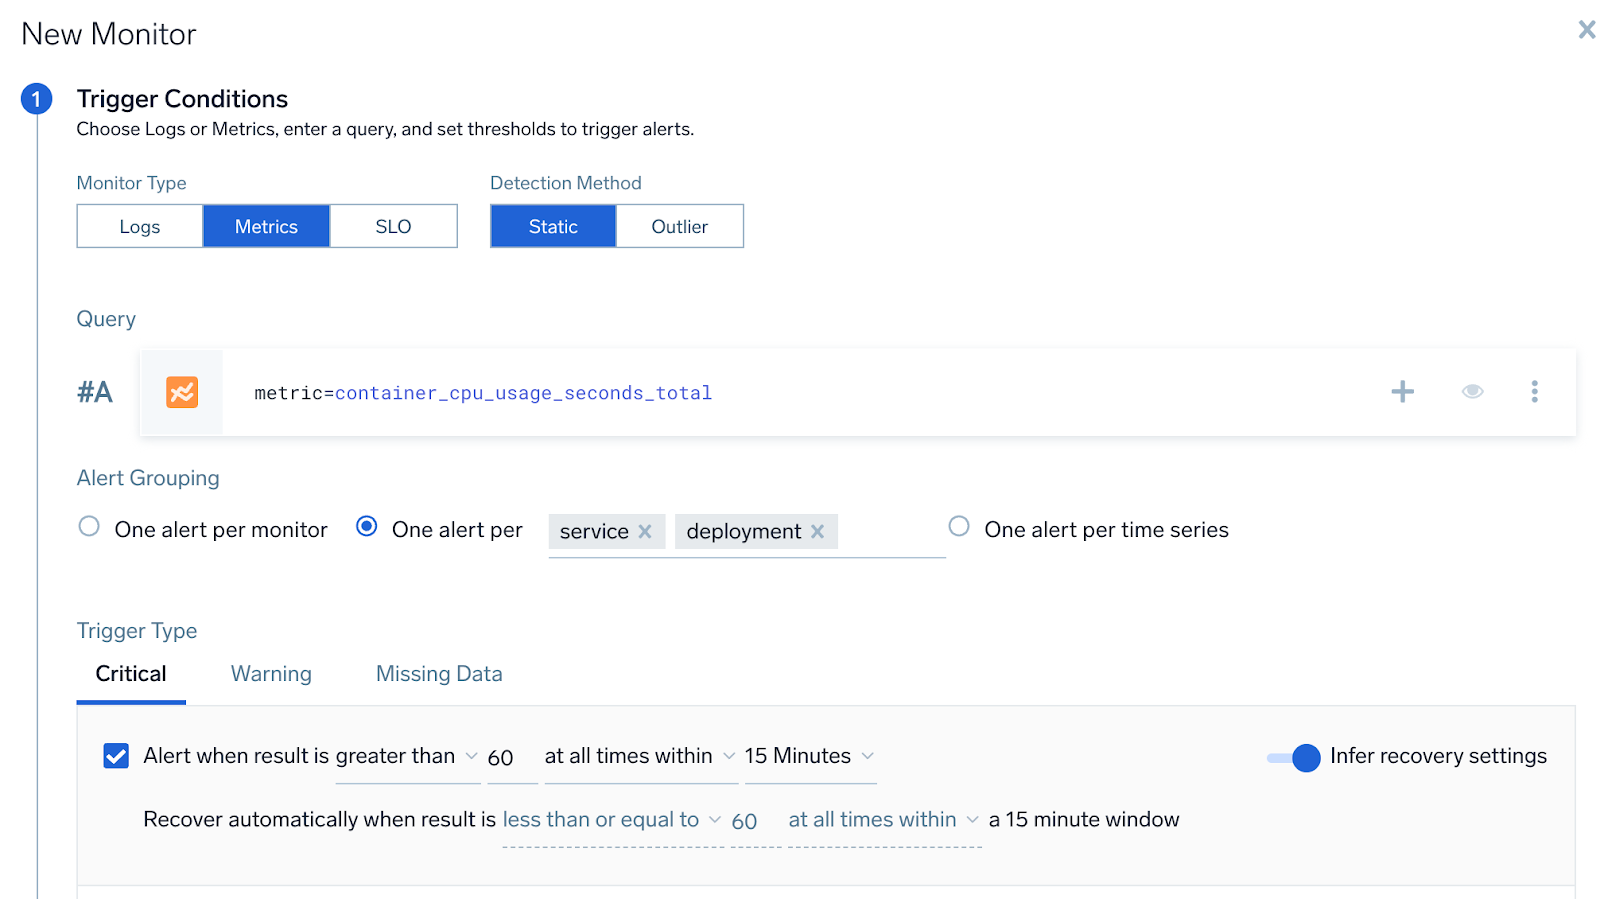
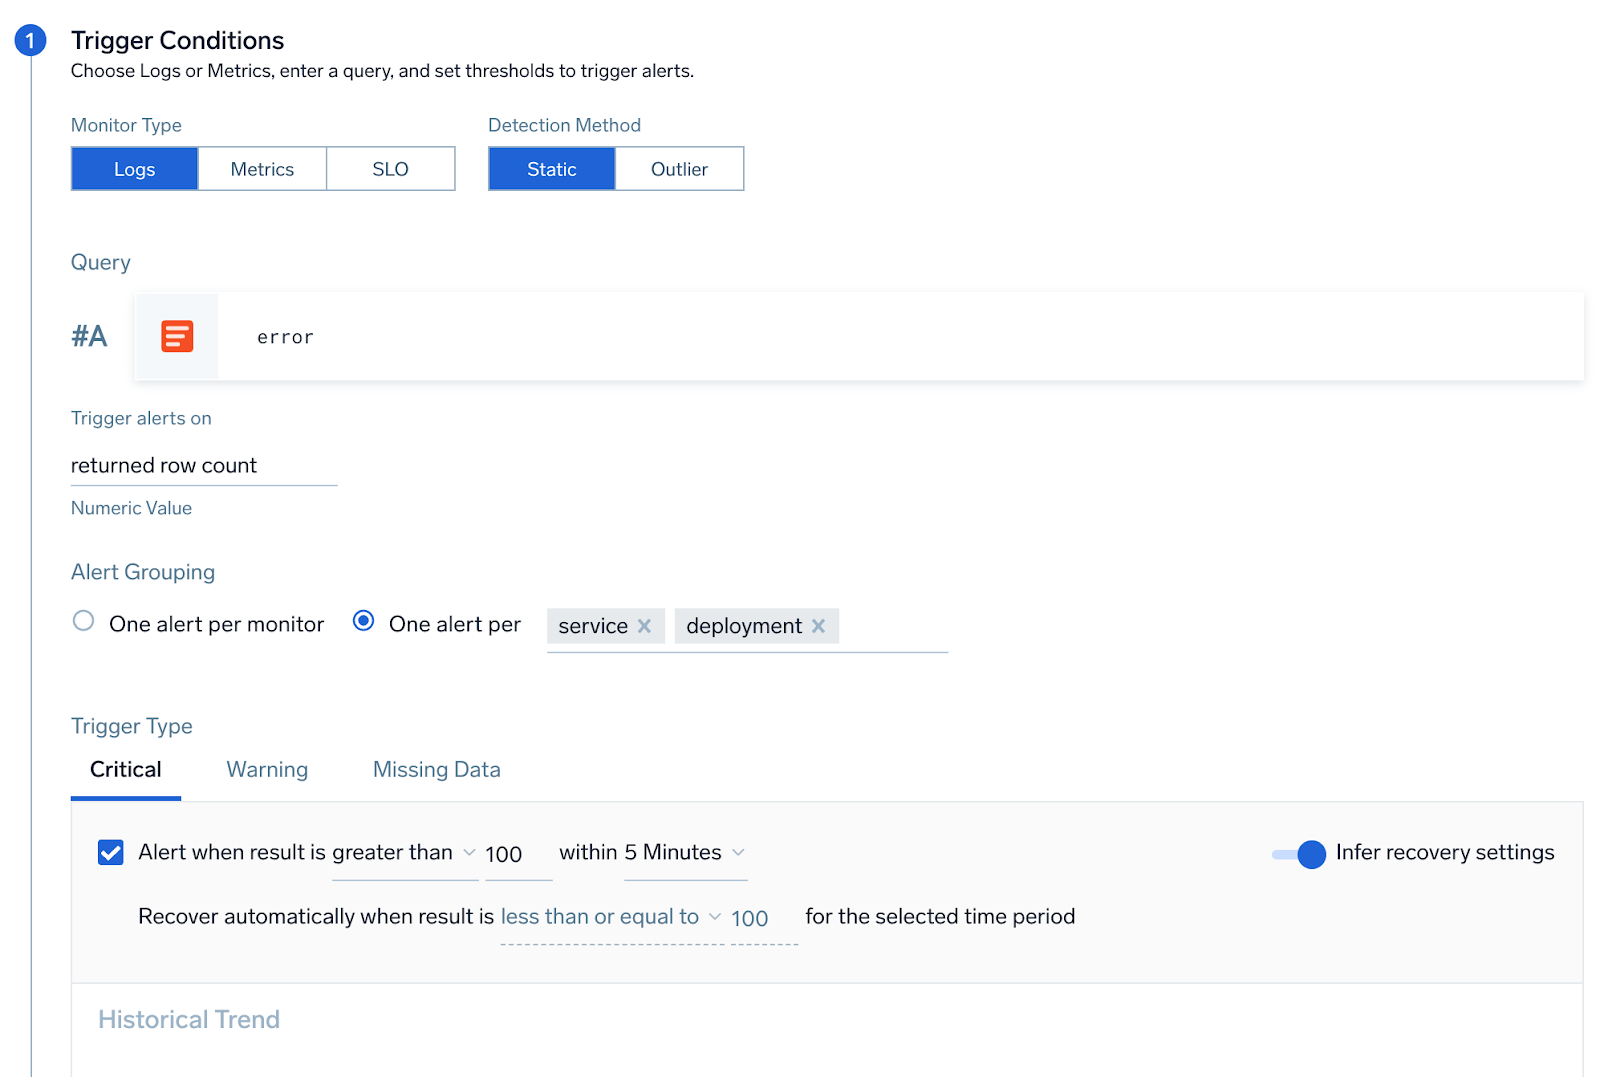
You can set up alert grouping for both metrics and logs-based monitors.
In addition to the alert grouping feature above, we’ve released several new capabilities and improvements for alerts to help you find and resolve issues quickly.
We’re extending the flexibility to configure alert auto resolution by enabling a couple of other parameters to help you create more stable alerts.
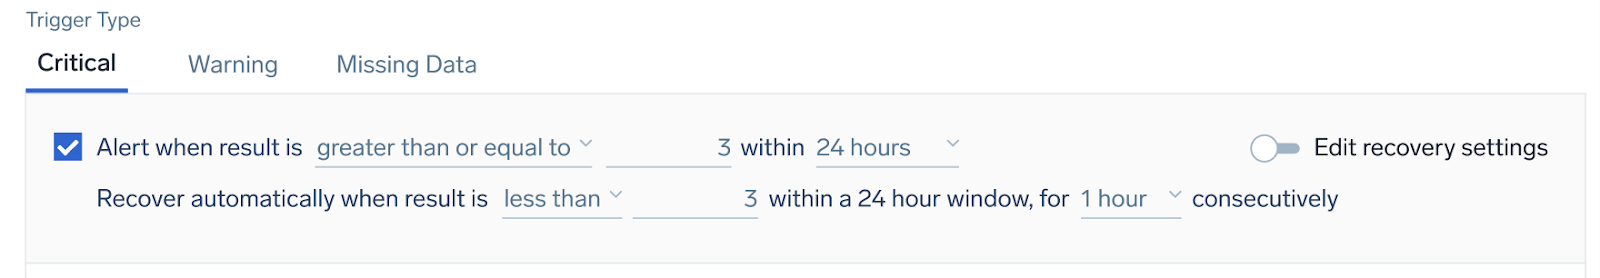
Users can specify whether a single data point (at any time) is sufficient or if all the data points (at all times) within the detection window should be analyzed for recovering an alert. This gives you more flexibility in defining how alerts get resolved automatically after the underlying issue is corrected.
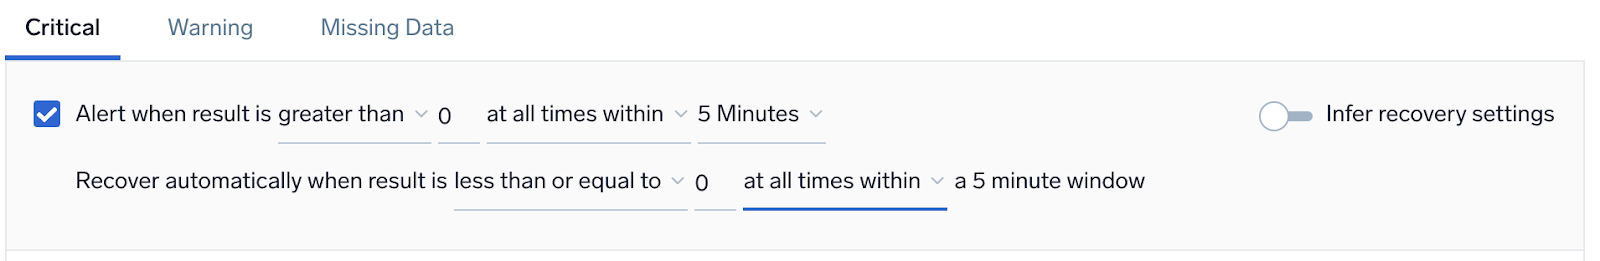
Users can specify a time period of normal activity that will resolve the alert. This helps you avoid alert flapping by letting you wait for an appropriate amount of time before resolving the alert.
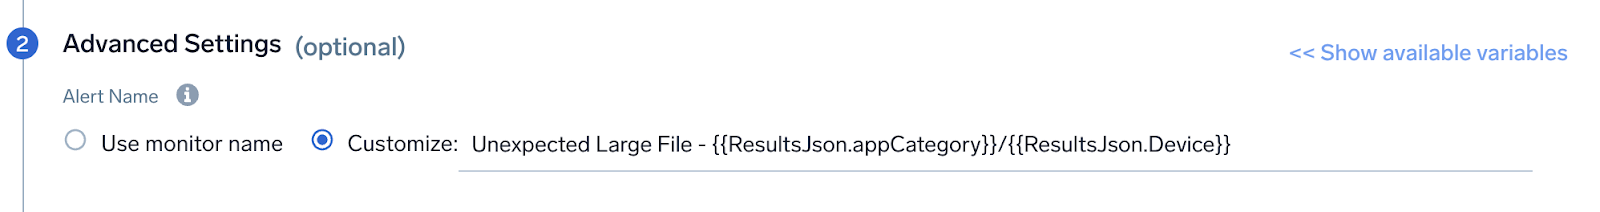
We are now allowing the monitor author to customize the alert’s name in the notification and also on the Alert Response page. This is important in many circumstances, especially when you have configured multiple alerts from the same monitor and want a unique name for each alert to make it easily distinguishable during troubleshooting. You can customize the name of the alert using free text and other template variables, as shown in the screenshot below
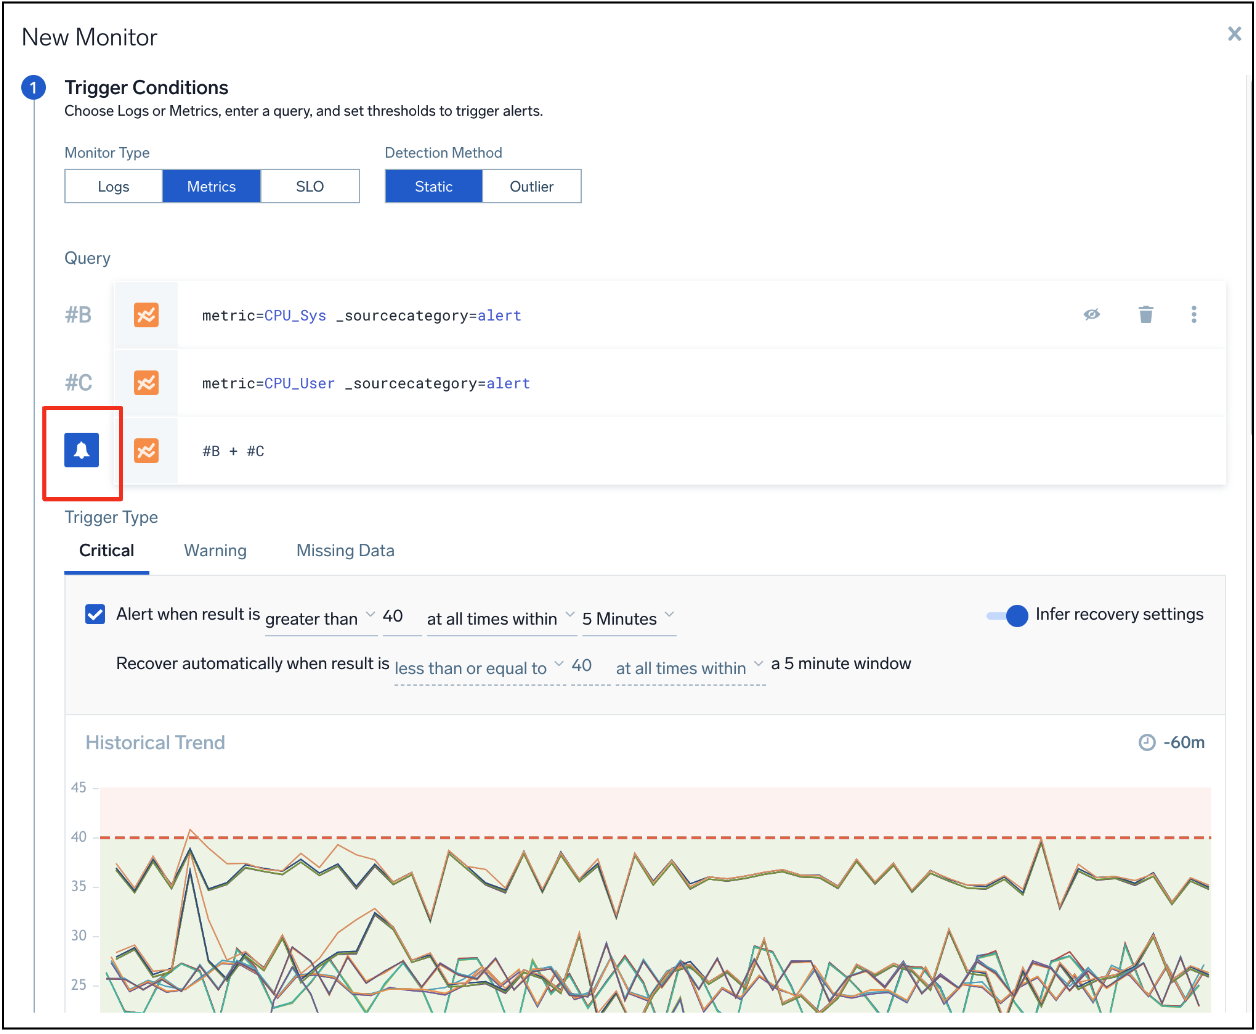
With Metrics Monitors that have multiple query rows, it is confusing for users to know which row is used for alerting. To improve usability, we now highlight the query row that triggers the alert on the monitor creation model.
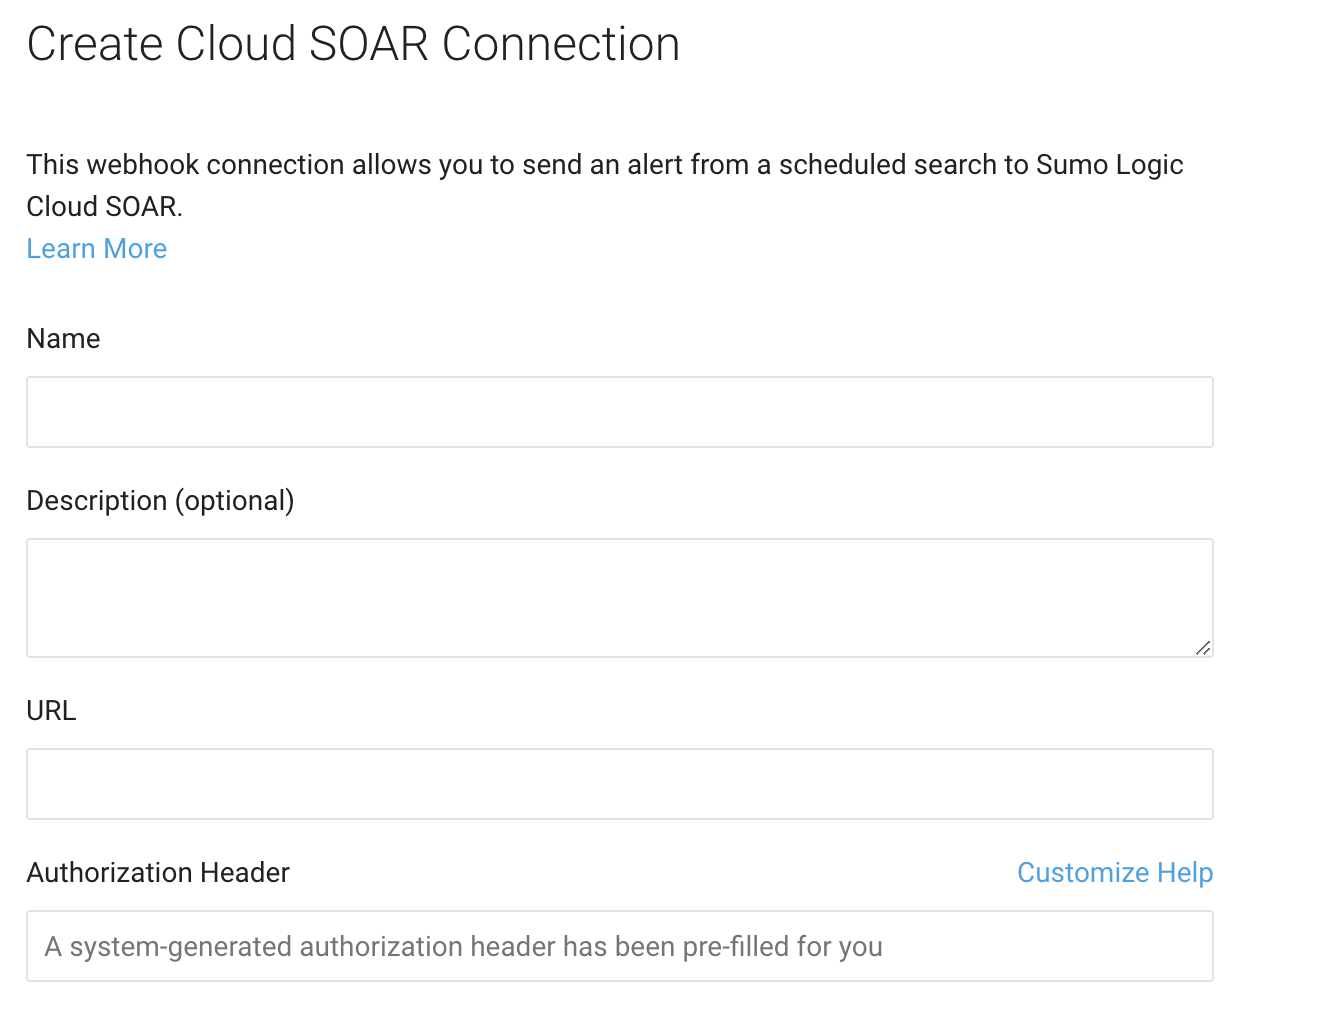
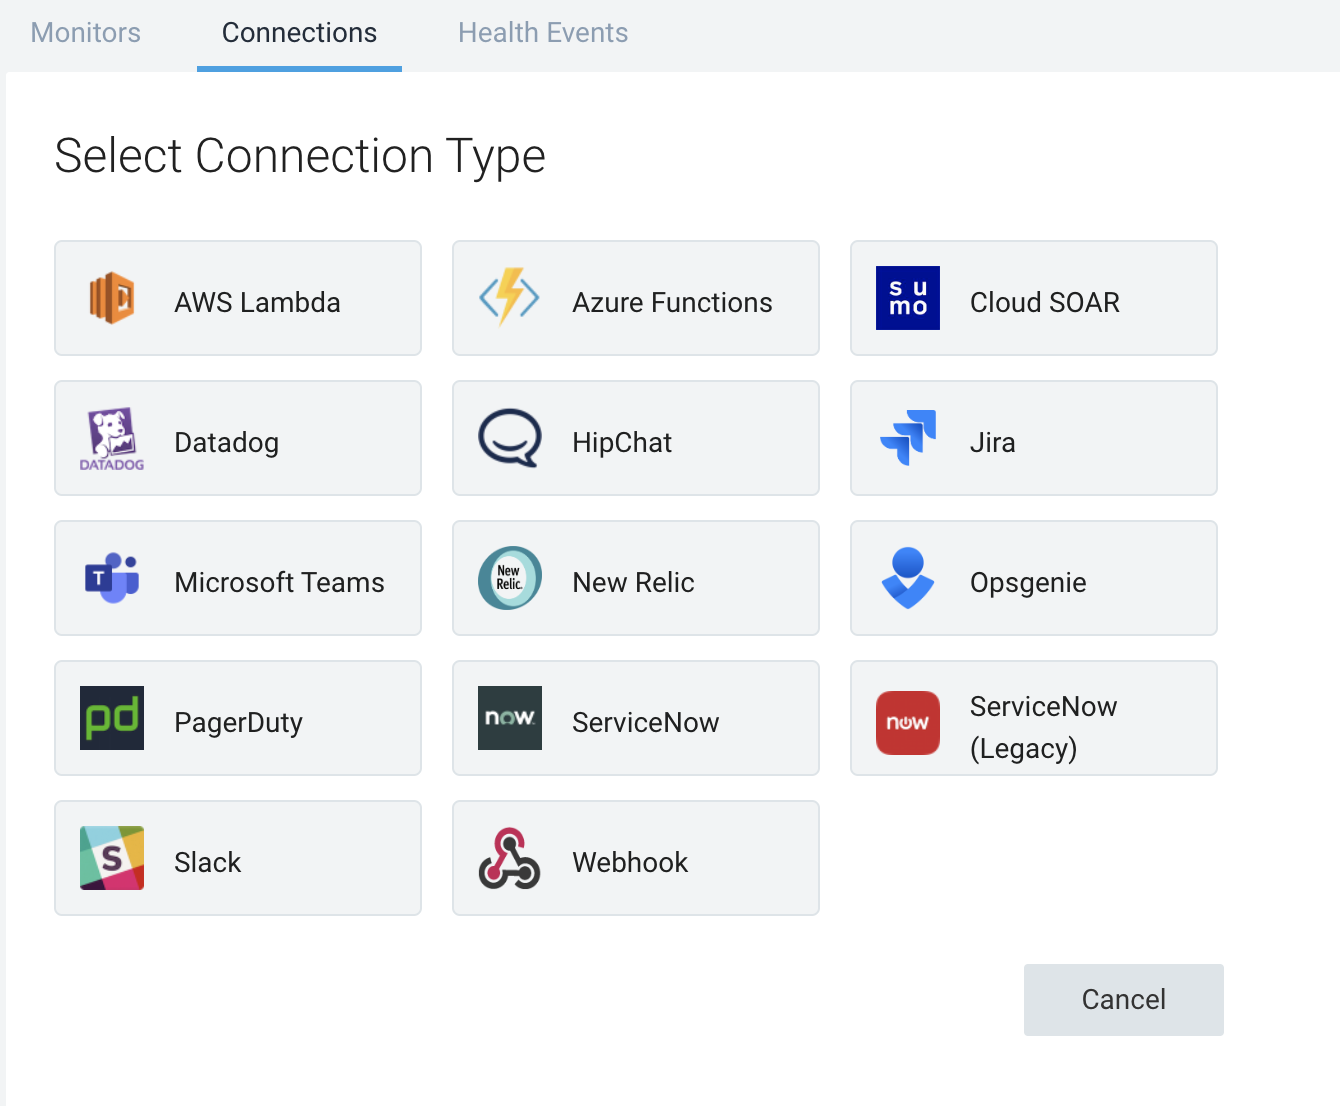
We are launching a new Cloud SOAR connection capability that allows users to create an incident in Sumo Logic SOAR directly from a scheduled search.
To learn more about Sumo Logic’s alerting capabilities, you can watch Angad Singh’s session on alert response from Illuminate 2022.
If you don’t enjoy videos or events, you can read more about application modernization.
Reduce downtime and move from reactive to proactive monitoring.
Build, run, and secure modern applications and cloud infrastructures.
Start free trial
No credit card required. Up and running in minutes.
More than 2,100 enterprises around the world rely on Sumo Logic to build, run, and secure their modern applications and cloud infrastructures.
