Get the report
MoreTelemetry automatically collects, transmits and measures data from remote sources, using sensors and other devices to collect data. It uses communication systems to transmit the data back to a central location. Subsequently, the data is analyzed to monitor and control the remote system.
Telemetry data helps improve customer experiences and monitor security, application health, quality and performance.
Collecting telemetry data is essential for administering and managing various IT infrastructures. This data is used to monitor the performance of different systems and provide actionable insight.
Monitoring tools measure telemetry events, including everything from server performance to utilization.
When monitoring an application to ensure acceptable uptime and performance for your users, start with components, such as physical servers and their overall availability.
Server monitoring — and monitoring computers in general — both involve enough telemetry that it needs to be a core focus.
Beyond an indication of whether a server is up or down, other event data and metrics to track include a server's CPU utilization, including peaks and averages over various periods. Things to look for include over-utilization, but under-utilization of CPU power can indicate issues just as concerning. For example, under-utilization can indicate anything, from network routing issues (such as requests not arriving) to unused application features.
Use individual server statistics for groups of servers to understand if CPU usage is a systemic problem, like overall application server stress, or indicative of a subset of out-of-date servers, such as older hardware or a server about to fail.
Other telemetry to monitor includes server memory utilization and I/O load over time. These are especially important when using server virtualization. In these cases, the statistics reported from virtual servers may not indicate CPU or memory usage issues; the underlying physical server may be oversubscribed in terms of virtualization, CPU, I/O communication with disks and peripherals, or starved of physical memory.
Finally, server-specific measurements must include user requests over time and concurrent user activity reported in standard deviation graphs. Not only will this yield server performance information, but it also shows the utilization of your systems overall.
Now that we've covered servers and their physical component telemetry let's look a little deeper at some of the foundational components of your application's physical build-out. This includes network infrastructure, storage infrastructure and overall bandwidth capacity and consumption.
As any seasoned IT professional can tell you, it's important to quantify network monitoring beyond the common statement, "The network is slow!" Network utilization monitoring includes measuring network traffic in bits-per-second across LANs and sub-LANs within your application infrastructure.
Understanding these segments' theoretical and practical limits is crucial to knowing when packets will be lost and when network storms may ensue. For instance, as you approach the bandwidth limit of a 100Mbps LAN segment, UDP messages will be lost, and TCP/IP messages that are lost will transmit, potentially amplifying the problem. Monitoring the network should reveal segment bandwidth usage over time across different areas of the network (between the application servers and database servers, for example).
Further, protocol-specific network monitoring will provide more granular insight into application utilization in real time and perhaps performance issues for certain areas of functionality (such as HTTP/S traffic versus back-end database traffic). Additionally, monitoring requests to specific network ports can pinpoint potential security holes (like port 23 for Telnet) and routing and switching delays within applicable network components.
Beyond raw network utilization, you should also monitor network-attached storage solutions. Specific telemetry is required to indicate storage usage, timeouts and potential disk failures. Again, tracking both over- and under-utilization of storage resources is valuable. For instance, a lack of storage system access can indicate the failure of a data backup plan or additional resources.
It's important to monitor key telemetry, which can involve database access and processing. It's crucial to watch the number of open database connections, which can balloon and affect performance. Reasons for this include large (and growing) pools of physical and virtual application servers, programming errors, and server misconfiguration. Tracking this over time can point out design decisions that don't scale as application usage increases.
It's equally important to monitor the number of database queries, their response times, and the quantity of data passed between the database and applications. This needs to include both averages and outliers. When looking only at averages, occasional latency can be hidden or overshadowed, yet those outliers can directly impact and annoy your users.
Your monitoring strategy should look at application exceptions, database errors or warnings, application server logs for unusual activity (excessive Java garbage collection), weblogs indicating concerning requests and so on. This is the start of monitoring security indicators in your application.
Many of the monitoring basics covered mostly apply to servers and your infrastructure. However, as public cloud usage grows, it's important to include cloud-specific telemetry in your monitoring plan and strategy.
Take baseline measurements before moving any components of your application to the cloud. As your deployment changes over time, or if you switch cloud providers at some point, you need to re-baseline your metrics.

Cloud monitoring includes cloud availability (checking for outages) and Internet latency and outages between you, your ISP and your cloud provider. But it should go further and include the following:
Internet routing decisions
Measurements of fixed or subscribed lines between you and your provider
Internal and external request latency
Cloud-to-cloud and ground-to-cloud timings to cover hybrid cloud usage
Other metrics vary by cloud service—especially PaaS—that you subscribe to, such as database, compute and storage.
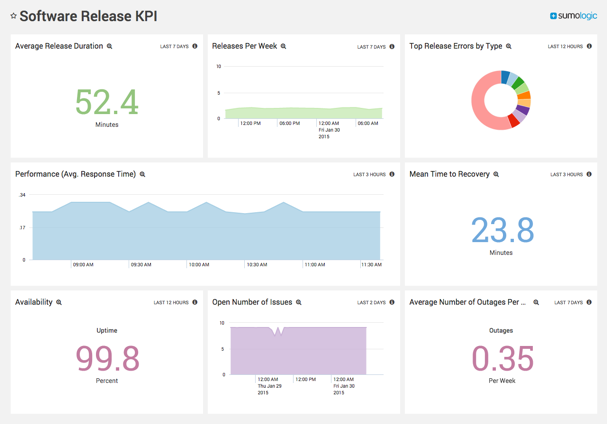
Application-specific monitoring should also include organizationally defined key performance indicators or KPIs. These are application-specific and have measurements such as transactions (as determined by your application) per second or other timeframes, request throughput and request latency to ensure they meet internal goals or external customer service level agreements (SLAs).
For e-commerce applications, KPIs may also include overall sales, credit card transactions, or the percentage of abandoned shopping carts per day. Looking deeper, you should also track database size growth rates, changing database index requirements, query plans and so on to determine future needs and optimizations over time.
Beyond application usage, it's important to include monitoring DevOps activity such as application deployments, continuous delivery and testing activity. Monitoring and understanding how these activities affect live systems can help optimize your DevOps procedures.

As important as it is to have a sound monitoring strategy, you also need to have a well-planned response strategy in place that includes the following:
First-level detection to identify, understand and begin root cause analysis of the issue.
A documented communication plan with the names and contact information of decision-makers, taking into account time zones.
Short-term fixes you can quickly identify to restore the application.
An investigation plan for future avoidance
Telemetry monitoring tools to use include:
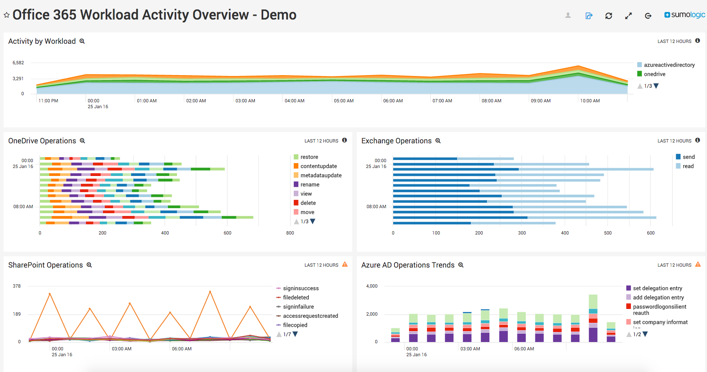
Dashboards or other visualization tools for real-time system telemetry and reporting.
Log parsing, using tools that safely work with production systems.
Business intelligence to mine your logs for hidden information, such as seasonal usage patterns or security incidents.
Automation tools that remove manual work with automated detection, recovery and risk mitigation.
Security analytics, like advanced threat intelligence, detect hacking incidents before they become security breaches.
Working with a telemetry software vendor will help you implement a sound monitoring strategy through a centralized system and ensure that it evolves and becomes more comprehensive over time.
Sumo Logic was one of the first observability vendors to support OTel tracing. Our Real User Monitoring (RUM) platform is an OTel JS distribution and fully compatible with the standard. We ensure that spans and logs are transmitted leveraging the OTel Line Protocol (OTLP). Also, The Sumo Logic platform supports ingesting telemetry from various existing vendors (such as Telegraf, Prometheus and Jaeger).
Reduce downtime and move from reactive to proactive monitoring.