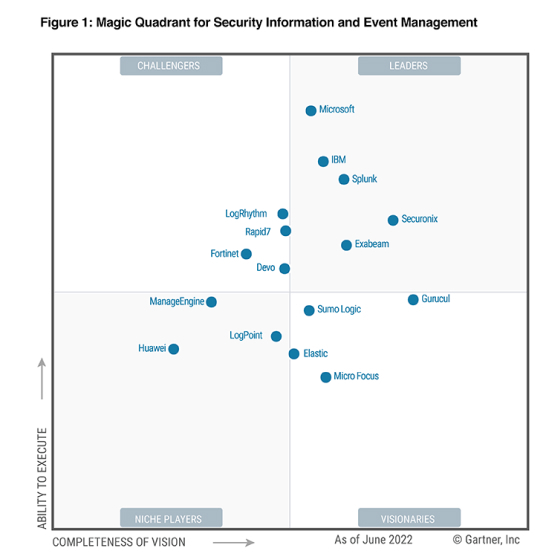
Get the report
MoreA service level indicator (SLI) is a specific metric that helps companies measure some aspect of the level of services to their customers. SLIs are a smaller sub-section of Service Level Objectives (SLO), which are in turn part of Service Level Agreements (SLA) that impact overall service reliability. SLIs can help companies identify ongoing network issues and application issues to lead to more efficient recoveries.
SLIs are typically measured as percentages, with 0% being terrible performance and 100% being perfect performance. SLIs are the foundation of SLOs, which represent the objectives that an organization is aiming to achieve. SLOs will determine which SLIs are underscored.
Below we’ll get into some of the most common SLIs you’ll encounter.
Some of the most common SLIs defined and measured by DevOps and SRE teams might include:
SLIs are the foundational elements for SLOs. And while organizations want to get as close to 100% SLO rates as possible, it’s important to remember that perfect SLO percentages are nearly impossible to achieve, even for the most efficient companies. Still, you should be shooting for high percentages, and below we'll talk about how you can determine which SLIs to focus on.
Companies need to understand that SLIs take time and resources to track and measure accurately, and in some cases, less can be more. Rather than measuring every SLI available to you, organizations should focus on a few SLIs that are the most relevant to their needs and objectives.
Below are a few service-focused categories that you can rely on to pick and choose the SLIs most relevant to your business goals.
User-facing systems and apps are generally most concerned with availability, throughput, and latency. This is all about speed and effectiveness when it comes to service requests—were requests handled well and promptly? How many requests could your systems handle before inefficiencies were exposed?
Storage systems underscore durability, availability, and latency. Storage systems are most concerned with how data is accessed and stored. Is data readily available when needed? How long does it take to review or read data?
Big data systems look at throughput and end-to-end latency. Data systems look at data processing pipelines and provide measurements for how long it takes for data to be processed and stored from start to finish on the data pipeline.
Correctness is relevant to all systems, SLIs and SLOs. Correctness has to do with how accurate you were in providing the right answer to your customers, retrieving the correct data, or providing the right analysis.
By focusing on a few key SLIs, you can make better use of your time and resources, narrowing your SLO efforts to the most relevant metrics and objectives.
To gather and track SLIs accurately, companies need to be measuring behavior on the client side, rather than the server side, so they don’t miss the various problems that affect users. For latency issues on user-facing systems, for example, if you focus on response latency within the backend, you might not notice latency issues due to the page’s front-end scripts.
This means that organizations should focus on aggregating raw measurements to get the clearest SLI responses and readings. Measurements can be simplified to avoid errors in the following ways:
Avoid creating averages because the amount of time it takes for specific requests will differ so greatly that an average will end up obscuring your results
Use a percentile for all your key indicators to ensure the most accurate distributions along with their differing SLI attributes
Aggregate intervals over a specific period, such as one minute
Track how frequently measurements are made, such as one measurement every 30 seconds
The key is to look at these metrics in their simplest forms. By looking at percentiles and per-second or per-minute intervals, you’ll have raw SLI metrics that can easily be measured.
While both SLOs and SLIs are technically subcategories of SLAs, it’s important to note that because SLAs are used so broadly across so many different contexts, most of the emphasis from IT and SRE teams is now placed on indicators and objectives.
For clarity and precision, it will likely behoove your IT team to focus on SLOs and the specific SLIs that pertain to those objectives.
Businesses are focused on achieving their goals, which is why they value robust observability platforms, like Sumo Logic, to help them measure their objectives and ensure they’re on track to meeting their KPIs, deadlines, and long-term strategies.
Try Sumo Logic’s free trial today to see how we can help you reach your goals and maintain quality assurance today.
Reduce downtime and move from reactive to proactive monitoring.