
2022 Gartner® Magic Quadrant™ SIEM
Get the report
MoreTrusted by thousands of customers globally.
Browse our library of ebooks, briefs, reports, case studies, webinars & more.
December 21, 2021
We are living in a data world. Data describes and controls almost every aspect of our life, from the president's elections to everyday grocery shopping. Data grows exponentially and so does the complexity of applications that manage that data. We all know the recent shift to microservices and other revolutionary changes that happened in the way we design, develop, deploy and operate modern applications.
There’s one thing that didn't change much though — at the end of the data processing pipeline, there’s always some kind of data warehouse. Obviously, the technology becomes more and more sophisticated and innovative, especially for big-data, NoSQL databases, but the main principle stays the same: the more data the backend can serve in a shorter time the better. And one more: if the database fails, it is a serious, most likely difficult to recover problem and most likely not without long-term consequences, often including data loss. Making sure our data vaults are healthy and operational has never been more important.
Sumo Logic already has a lot of existing logs and metrics-based applications that help you get kick-started with database monitoring. If you know your technology stack and you can gather logs and/or metrics and send them to Sumo, you can start right away with very valuable insights gathered directly from database internal observability signals.
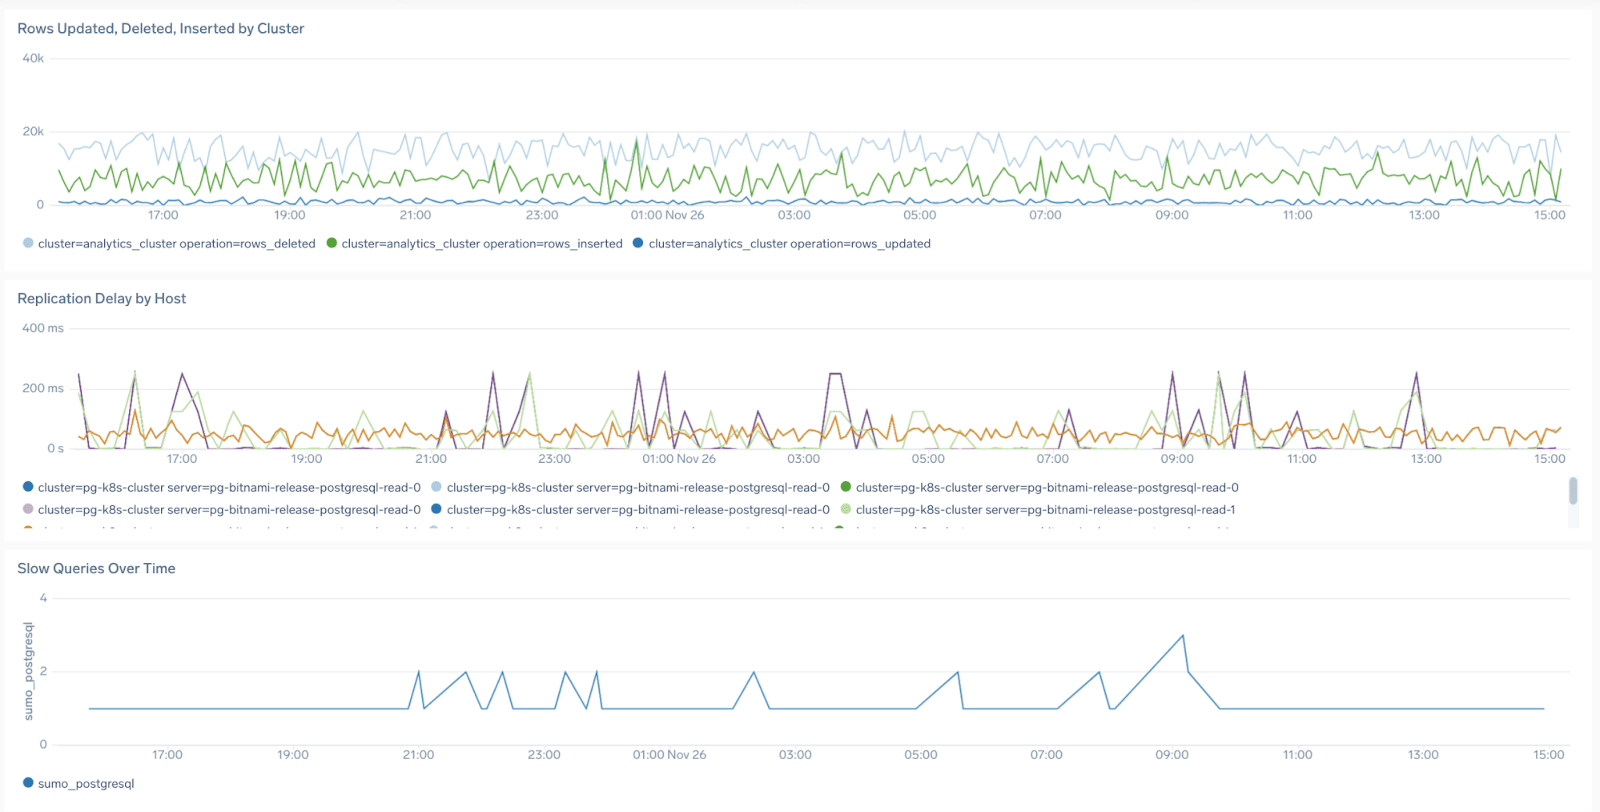
You can gain visibility into the health, performance, and behavior of our databases with KPIs like failed logins, slow queries, connections or deadlocks for technologies like PostgreSQL, MongoDB, Microsoft SQL, and others.
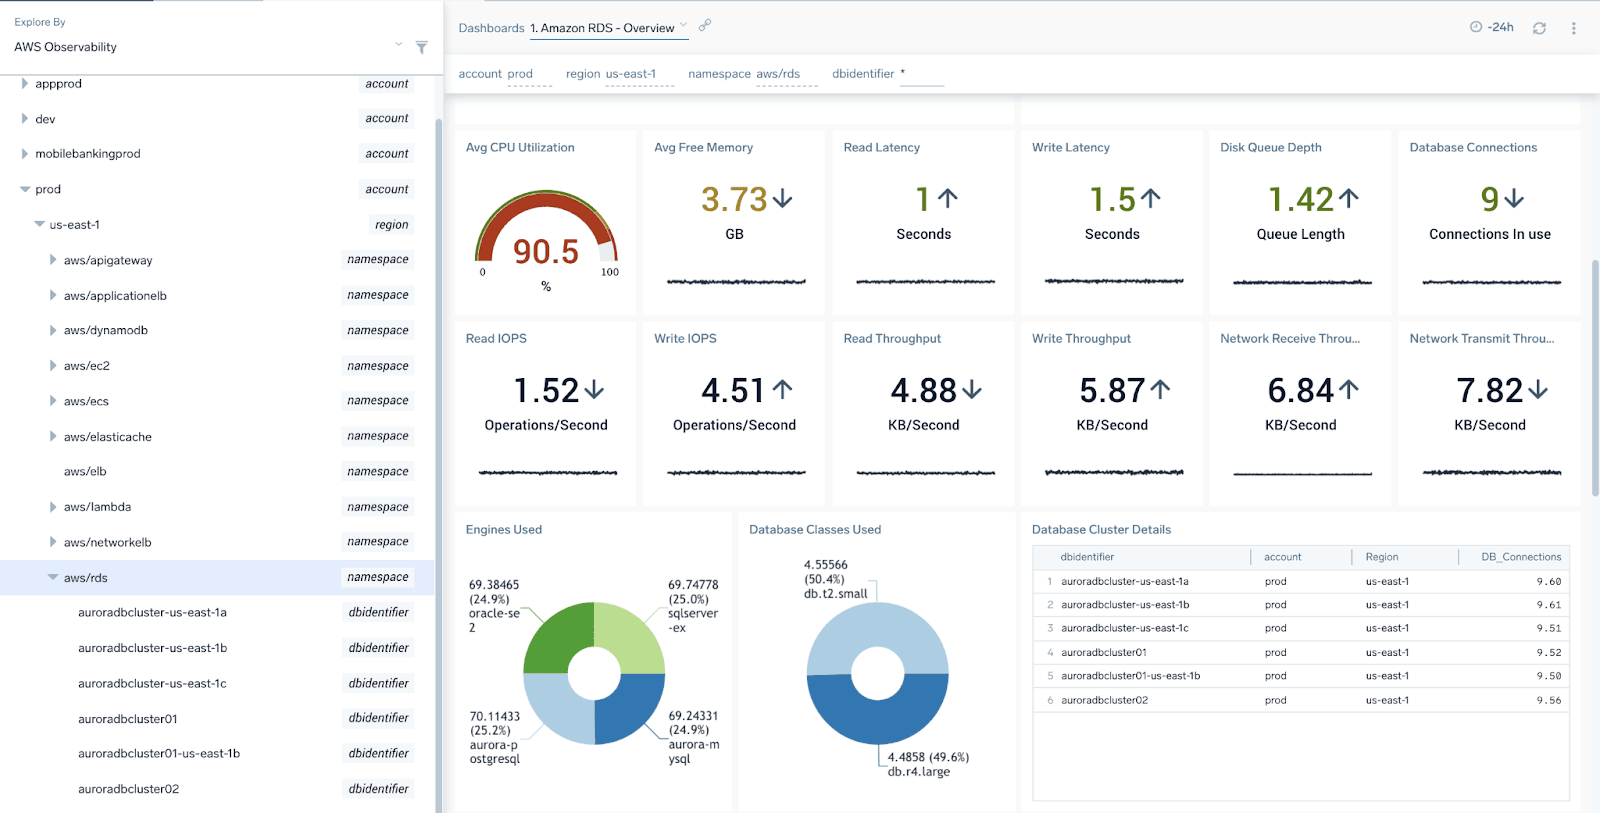
If you are using a hosted database service like AWS RDS for example, also data sources like CloudWatch are an interesting way to get more insights into the performance of your cloud database infrastructure. Sumo Logic makes it easier for you by aggregating data from multiple accounts and namespaces to have all your database health in one place:
These are great insights for database admins and an invaluable source of information, but in this article, I wanted to expand the context a little bit.
Every database is part of a wider application infrastructure, often a shared part, and almost always is just a final, very important, but only one step of multi-tiered transactions executed by users.
Understanding database health and performance from the context of user transactions and overall application performance puts a new light on the ability to observe the system’s internal state, but it is also not a straightforward task to complete.
Fortunately distributed tracing data comes to help.
Now you may ask - what do you mean tracing for a database? I’m not going to risk my precious database and install any 3rd party libraries on it! Besides, you may not even be able to if (as mentioned above) you are using a hosted service for your database infrastructure, right?
Nothing to worry about –- application monitoring instrumentation is prepared to handle database observability completely from the client-side. At last — that’s what the main purpose of the database is — to quickly serve client requests and queries. If the client is happy –- the database does a decent job.
As you may know already, application monitoring is currently trending towards OpenTelemetry and the project, although only two years old, has already a lot to offer in measuring how the performance of databases looks from the client point of view. Here’s an example of supported technologies (clients) for Java OT auto-instrumentation, that don’t require any configuration or coding work to start getting very interesting insights into database health right away, with the granularity of a single query. That includes specific technologies like Cassandra or MongoDB but also more generic database drivers like JDBC. Java here is just a vanilla example, other languages like JS/Node, Python, .NET, GO, etc. have an equivalent range of supported clients.
So, what can we get out of it? Let’s take a look at a few examples from Sumo Logic out-of-the-box dashboards and views.
Let’s start with some high-level use cases: just show me my databases, what apps do they belong to, what other services do they talk to and support.
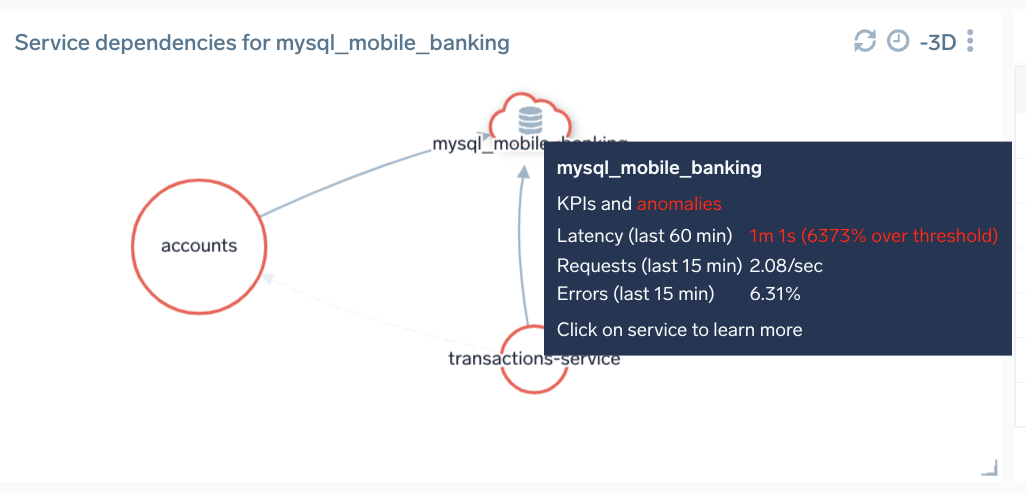
We can see above that our application consists of several services like accounts, payments, transactions but also a MySQL database (called mysql_mobile_banking). Another panel is also showing us the dependencies of this database - what other services are calling it and what is their health:
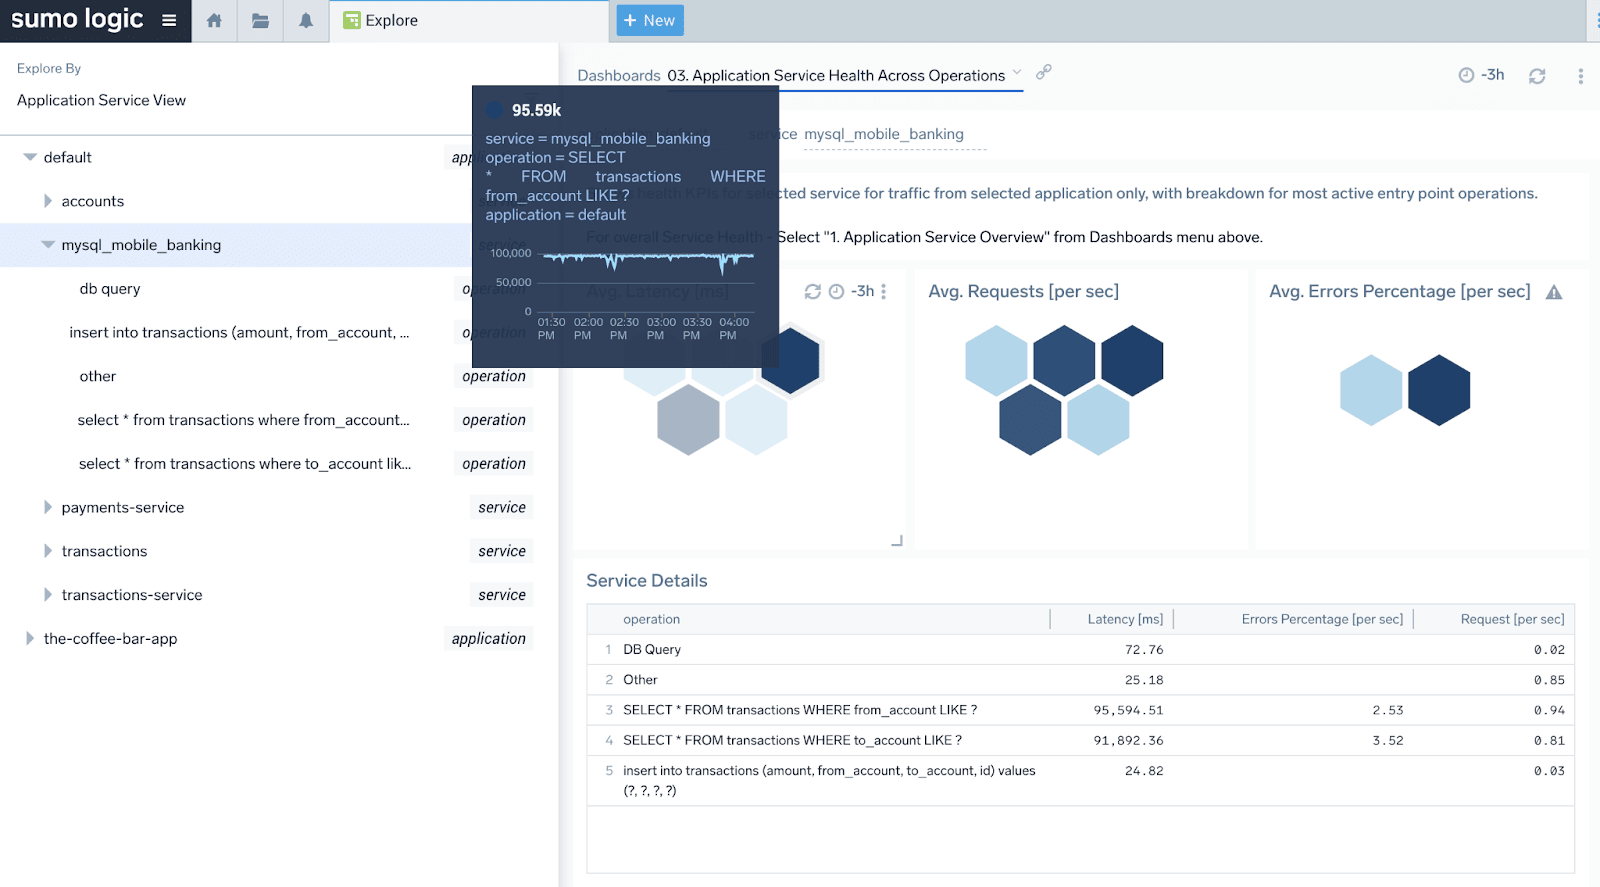
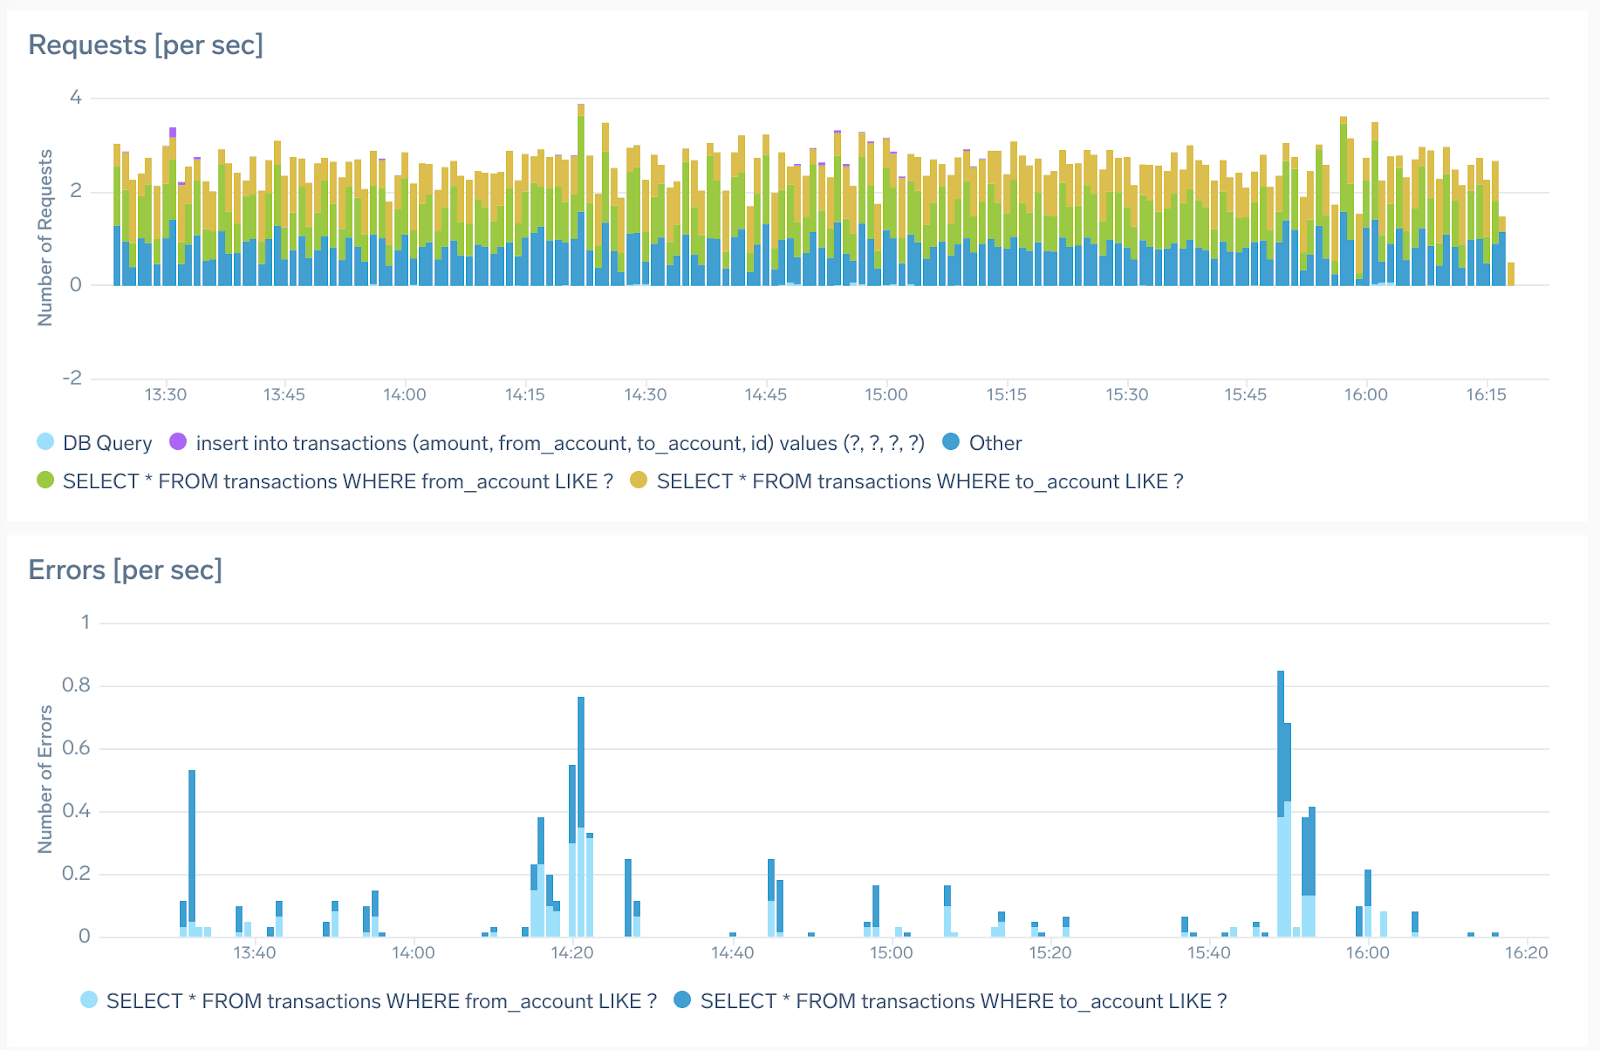
We also have automatically tracked four of the most important operations (groups of queries). These are tracked automatically by the client instrumentation and the Sumo Logic backend automatically calculates KPIs for the most used queries. KPIs like requests, latency, and errors can help you quickly understand the current and historical performance and health of the database as a whole and per individual query group. As you can see dynamic parts of queries are automatically masked/tokenized. No configuration is required.
If you are interested in learning more about these dashboards and Service Maps — check out one of my previous blogs discussing related use cases.
Each of these out-of-the-box panels is fully customizable with metrics query driving them, giving you full access to modify the query or change visualizations if that better serves your use case.
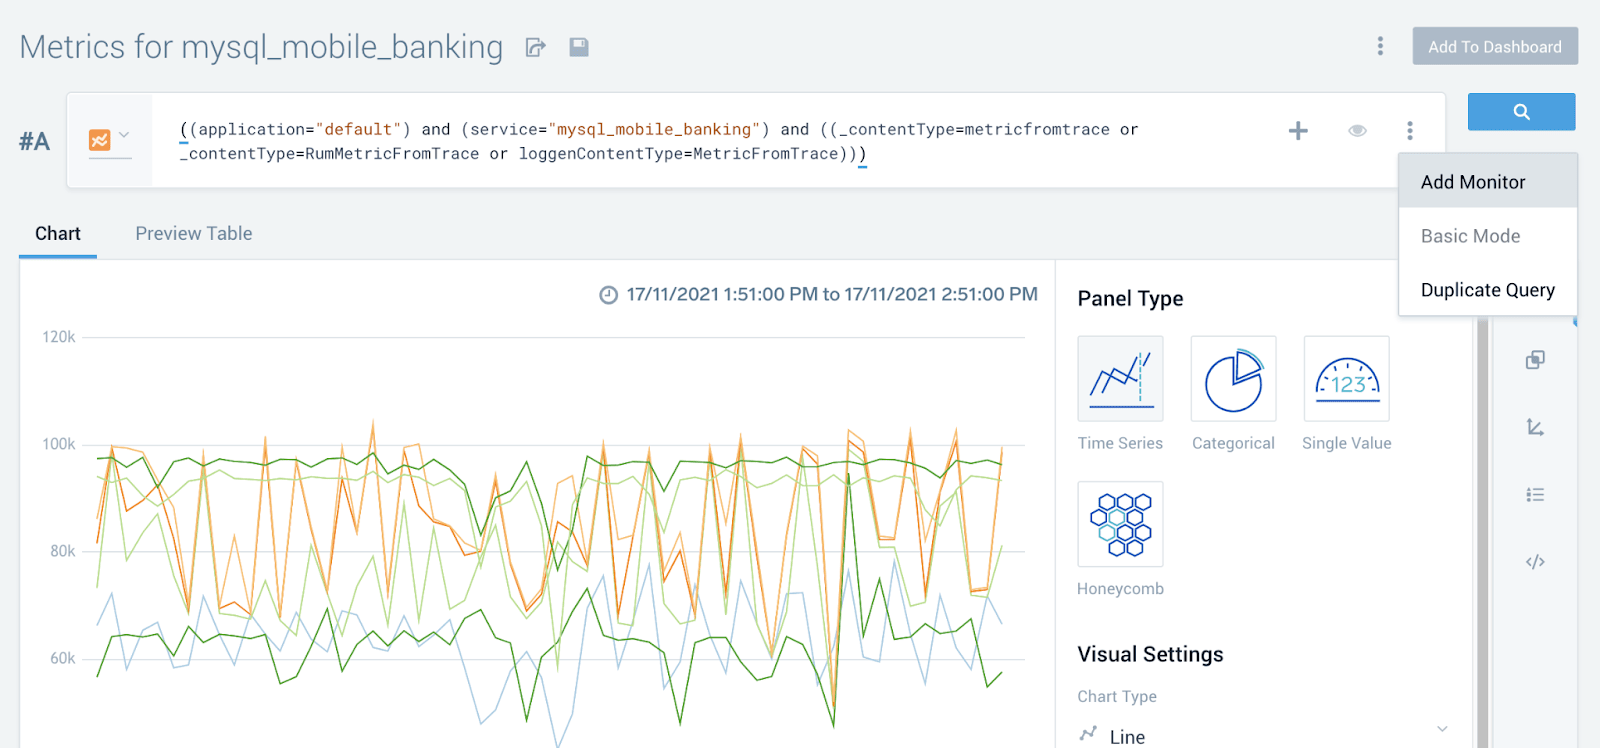
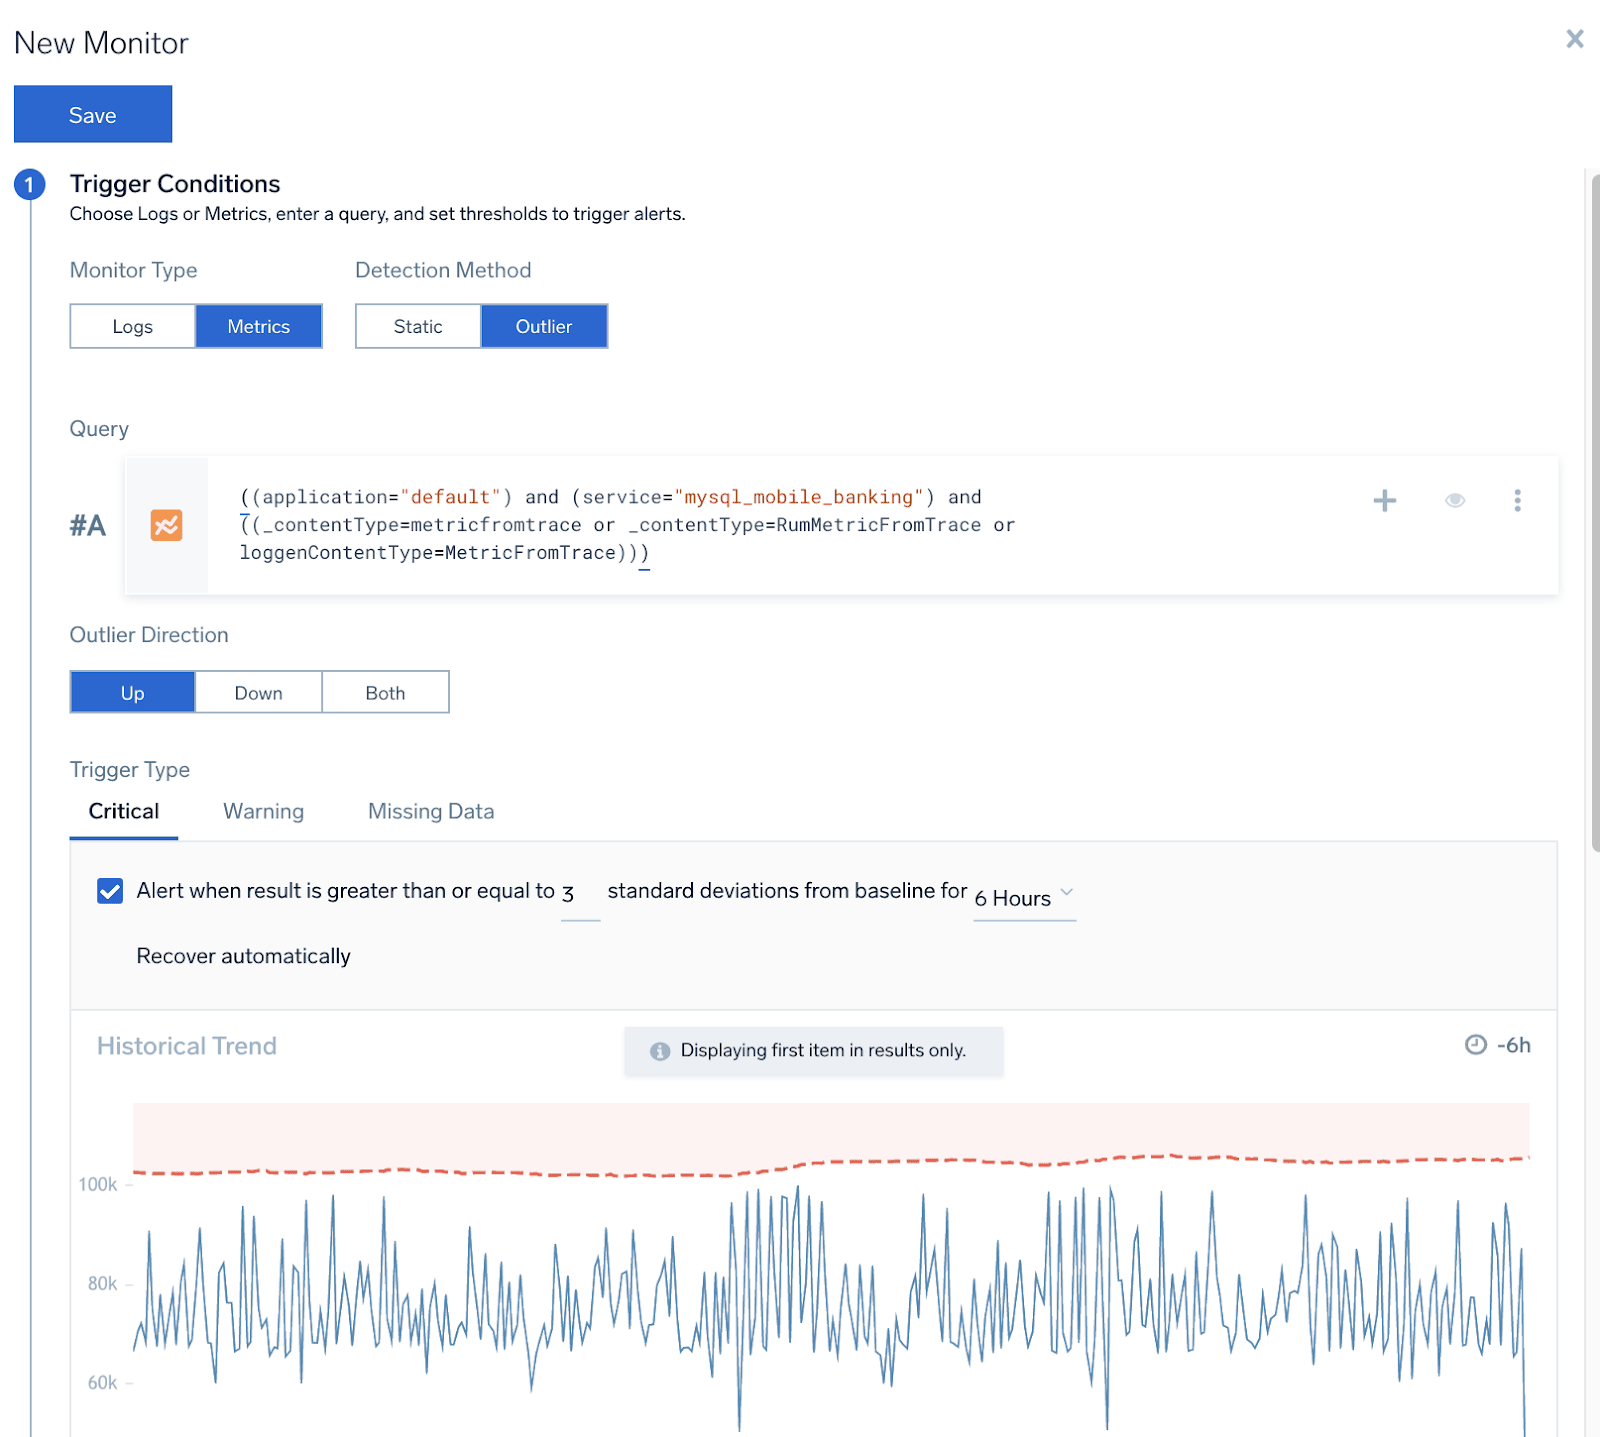
If you are interested in getting proactive notification about spikes or threshold breaches, you can add a monitor right from the window above. This lands you in the “New Monitor” configuration screen below, where you can, for example, set up an anomaly-based rule that will generate an alert and send a notification to the chosen alerting integration channel when any sudden spike occurs.
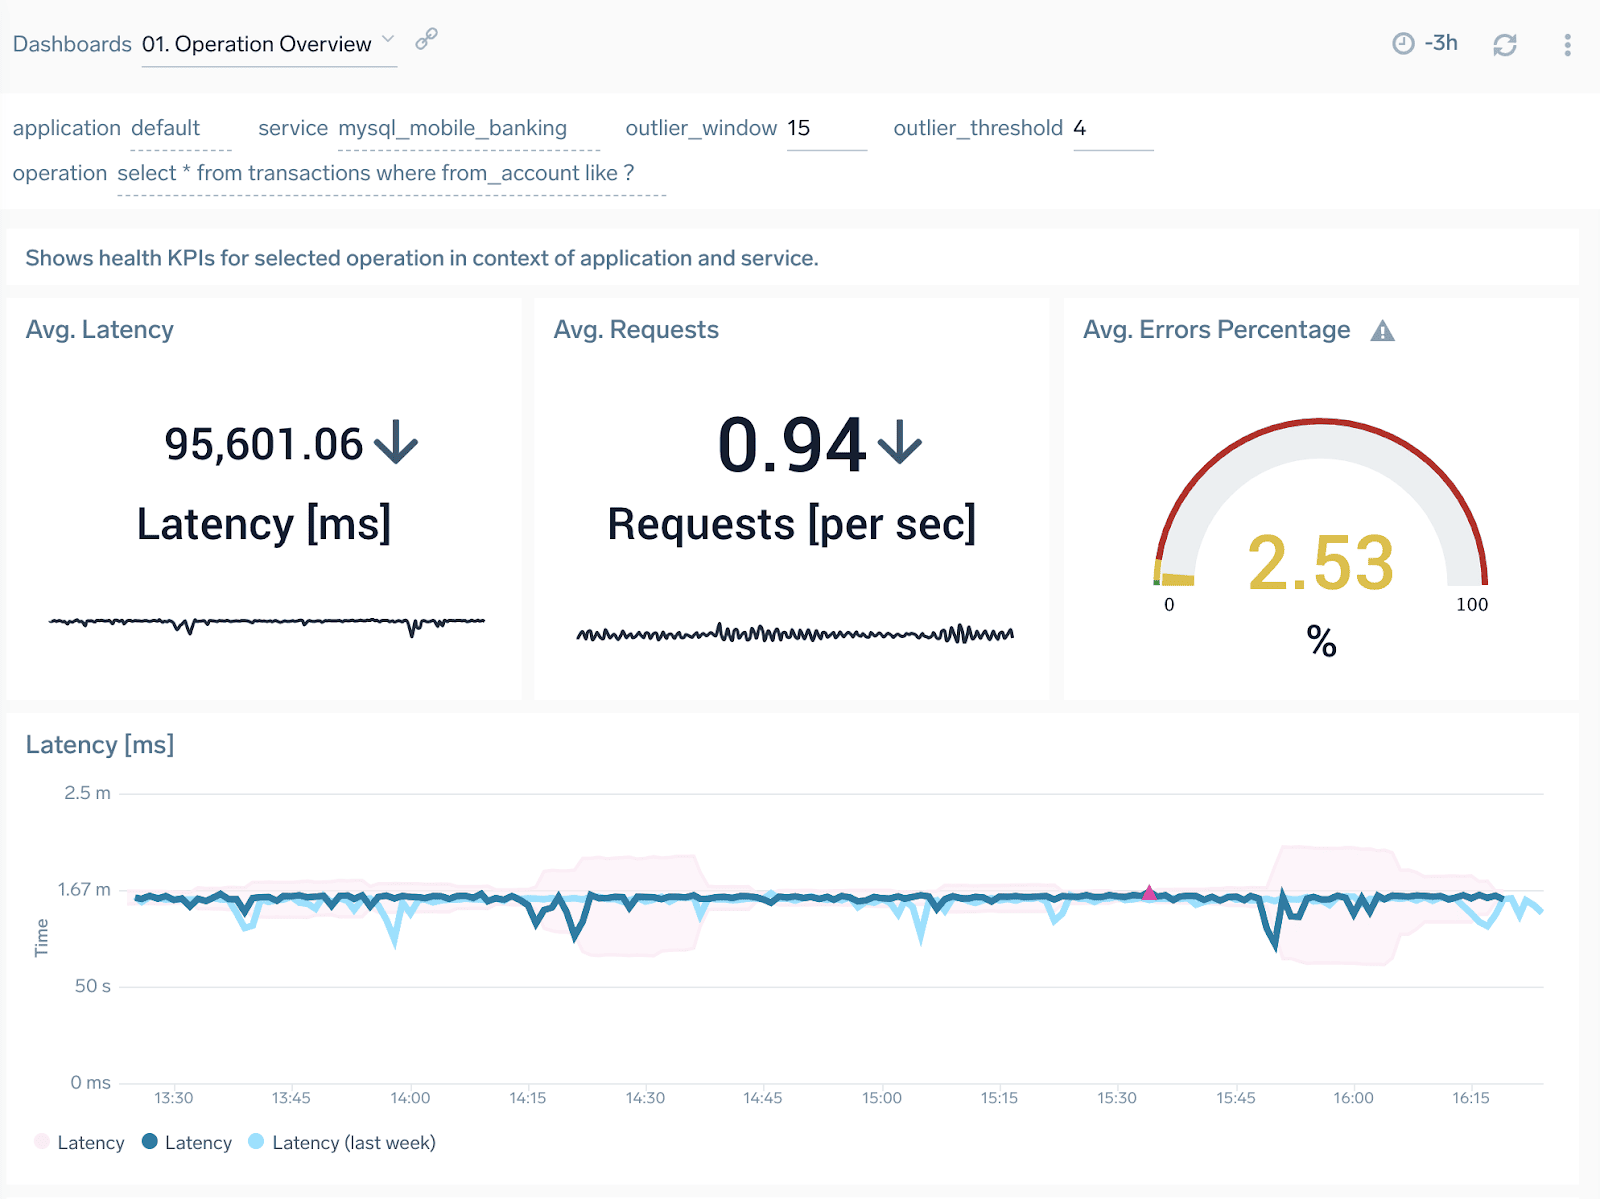
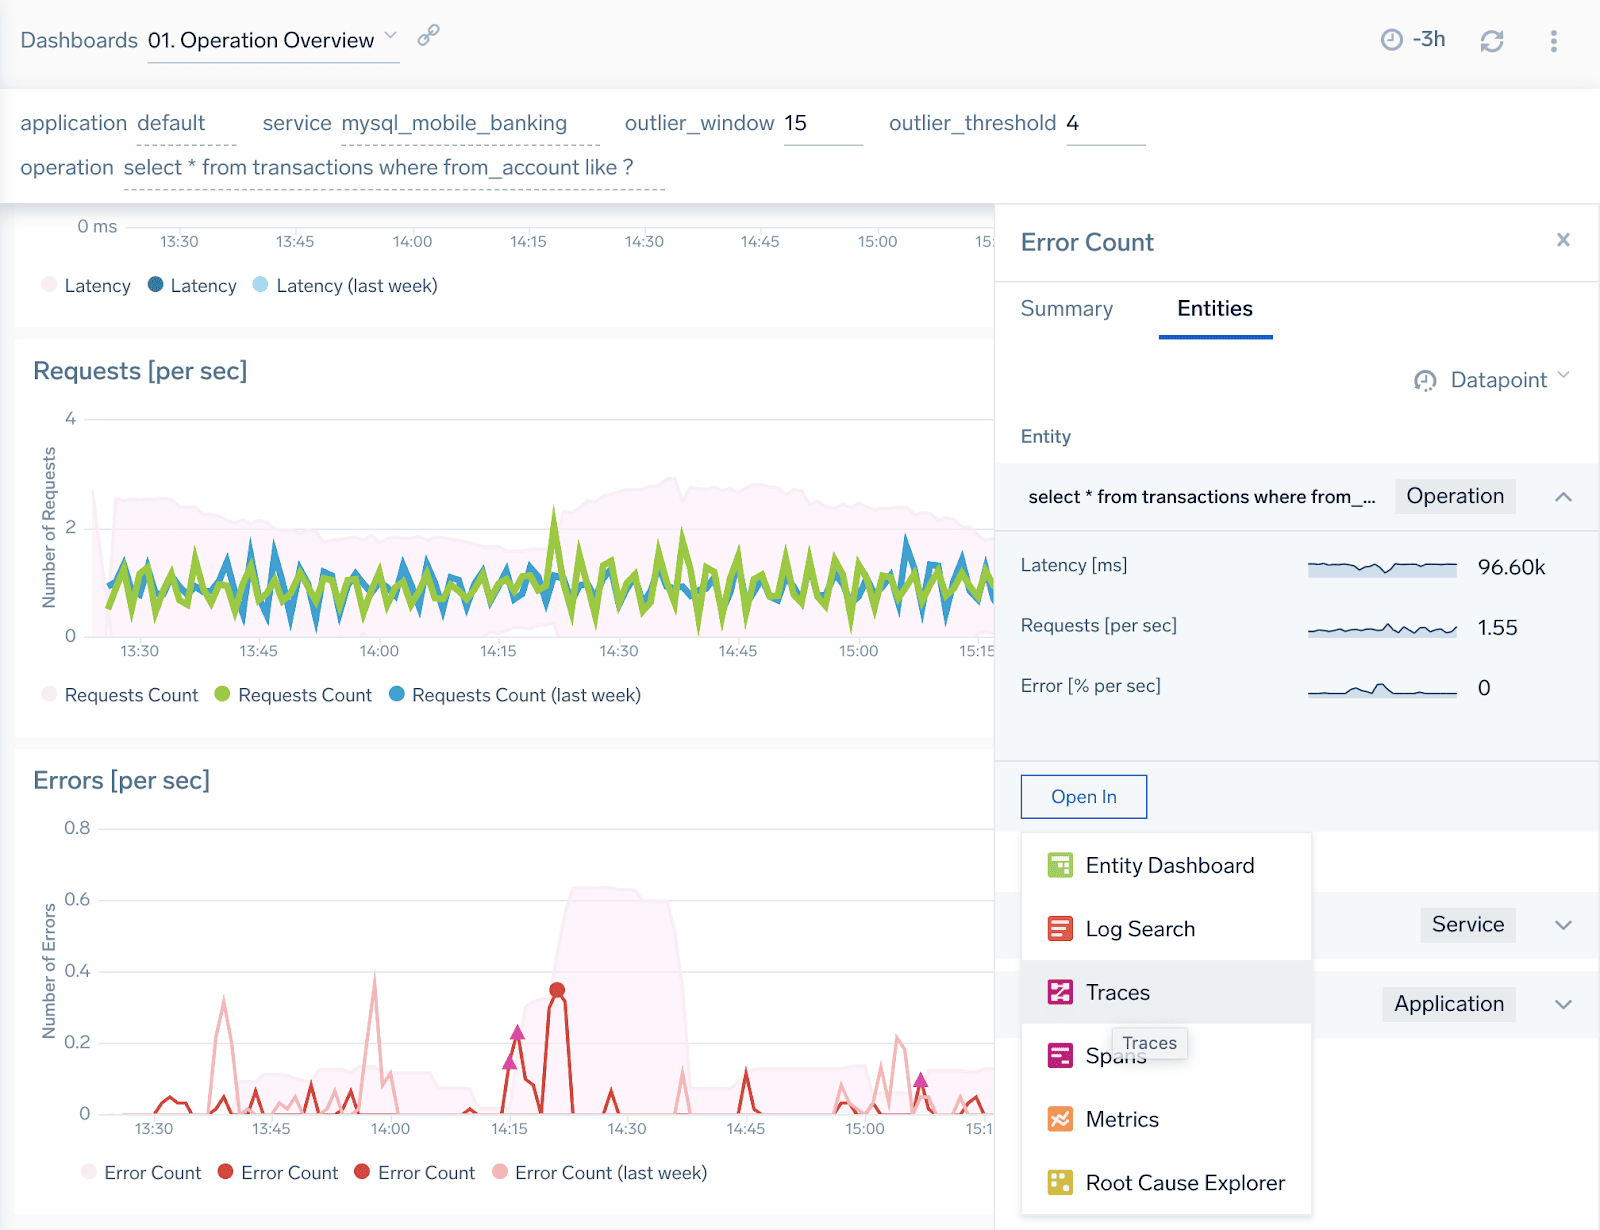
If you are interested in more detailed information, for example, KPIs on the operation level –- you can also drill down to query group-specific dashboards where you can track, observe and set up monitors for KPIs on this very granular level. Below, for example, we can see that our selected operation has quite a long latency of over 95 seconds, which is not different than usual (compared to last week) and also has some occasional errors not exceeding 3% on average.
So, what do we do to learn more about it? How can we investigate example transactions where this query was so long or the ones where it had errors? What if we got an alert about a sudden spike and we want to investigate?
In Sumo Logic dashboards, you can always click on the chart and get the entities panel that not only recognizes a related entity automatically (here the database service and its selected operation) but also provides contextual drill downs to logs and traces for this entity. Let’s click “Traces” to learn more.
We landed on a traces list that shows us end-to-end user transactions that have been using previously analyzed query operation to complete. We already see that their load times (“Duration” column) are not so quick, to say the least, and the majority of the time is spent in the database service (pink mysql_mobile_banking).
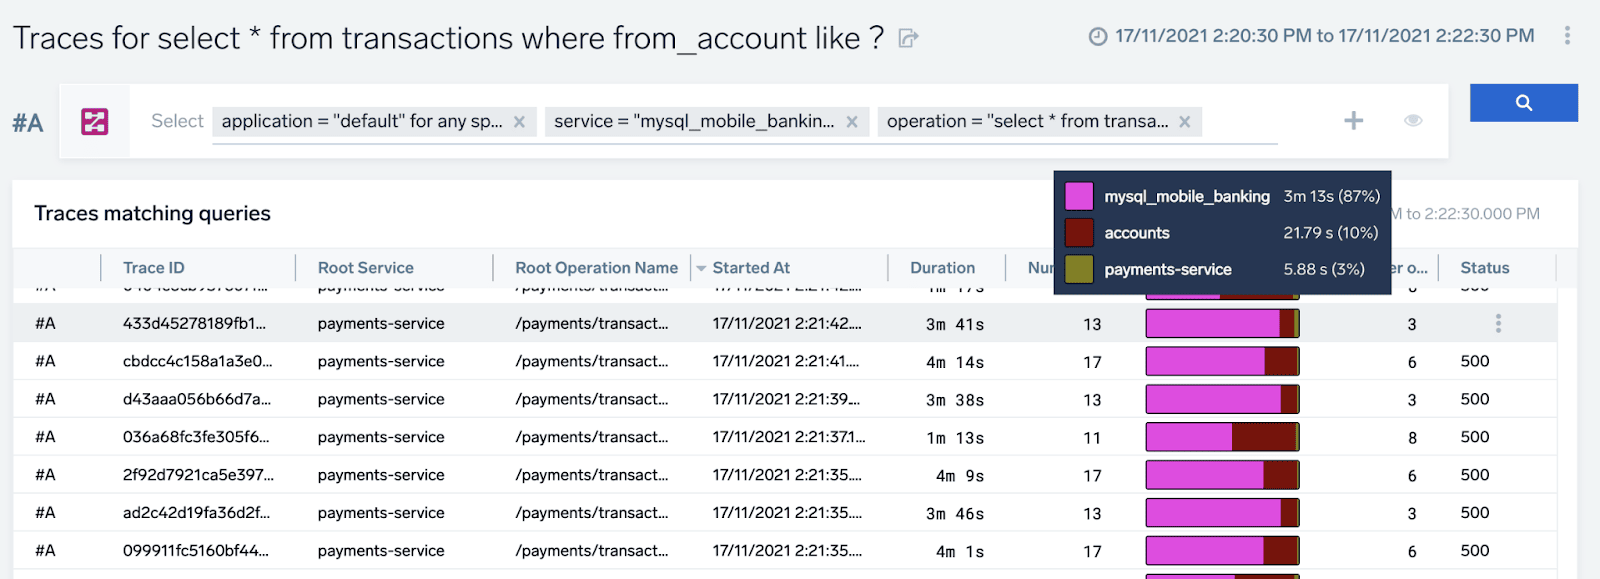
The database is at fault here and has a lot of room for optimization. If we are interested in an even more detailed and granular view, we can drill down to any of these transaction traces, to see precisely what the load sequence looked like during the execution of the transaction.
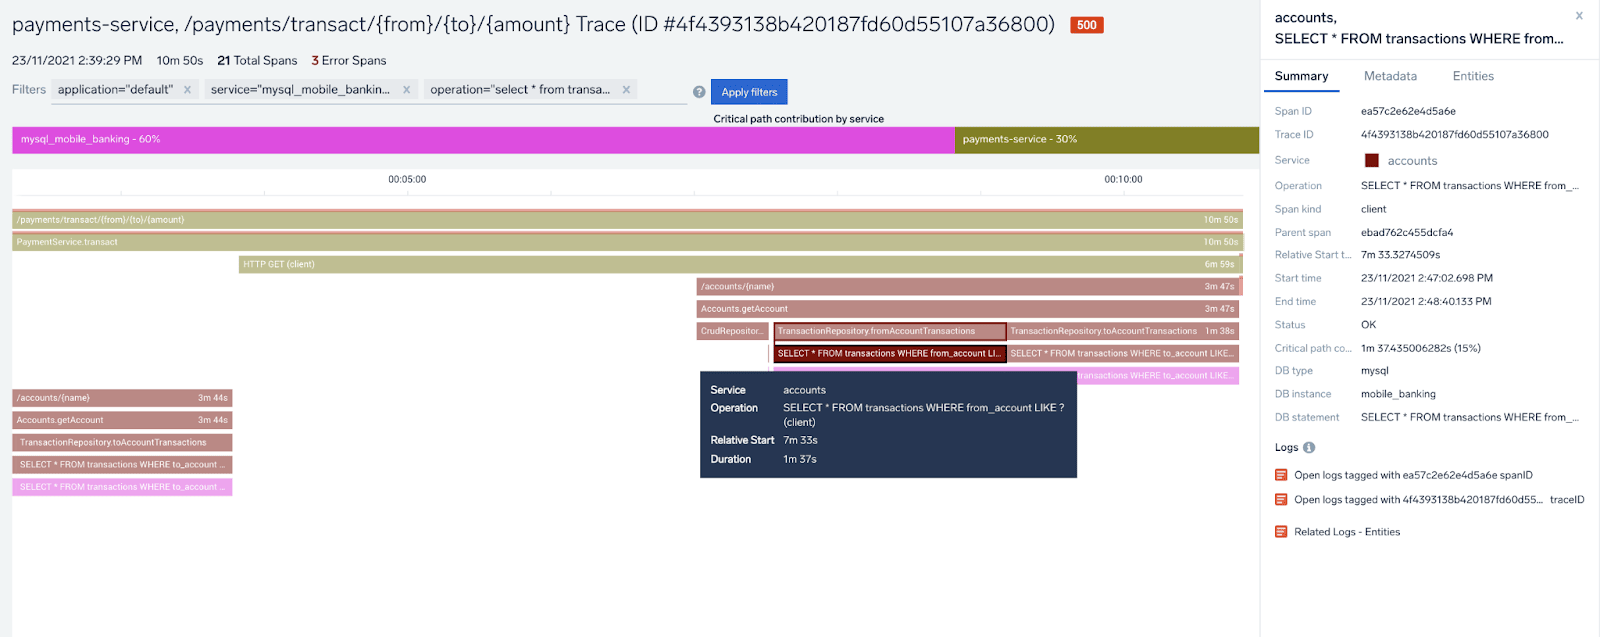
Sometimes here we can learn things like non-optimal, sequential database calls in large numbers which always are subject to optimization, but here actually are just 3 queries from accounts service (dark brown) to our database taking a lot of time (over 32 seconds for highlighted query). Something for the database developer to look at, if we are expecting these transactions to run faster, although, to be fair, there’s also a considerable processing time inside olive-colored payments-service too (middle of the chart), contributing to 30% of the total end-to-end transaction time.
An interesting thing about OpenTelemetry spans, which carry the information about client calls like database queries, is the metadata that is automatically added to them to tell the wider context. Besides a full database statement, we can also learn about the database connection, name, system, and user that has executed this query. This is also a good place to insert your custom metadata - anything that can help you troubleshoot this faster.
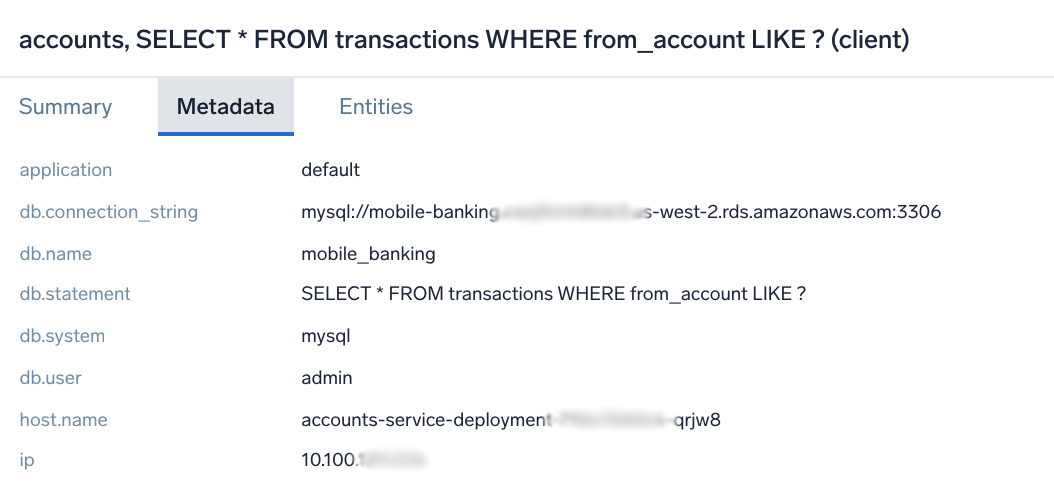
It can be any information about the user type, customer profile, transaction context, even a dollar value if that’s important. You can leverage it not only here, in the detailed view, but also during aggregated ad-hoc analysis that we are going to cover next.
Many classic APM tools don't give you full access to raw data. It’s just too much to handle for their backends. Sumo Logic is different — we are a true cloud big data platform and can allow you to analyze all your data in full fidelity, regardless of cardinality, with full details including custom metadata, without any need to pre-configure the schema.
This can be very useful when you are looking for the needle in the haystack, but also helps you to perform any kind of custom analytics on top of that data.
Aren't out-of-the-box KPIs good enough? Create your own. You can directly use Sumo Query Language for this, or a new Span Analytics interface that makes it easy to achieve even for novice users.
Let’s say that we want to analyze 98 percentile of duration, but only for database queries that have “price” text in them and have finished successfully (statuscode=OK). We want to visualize this in the form of a time series of 1minute granularity, individually per each database statement string. Here’s how such analysis works in the Span Analytics (“Spans”) interface:
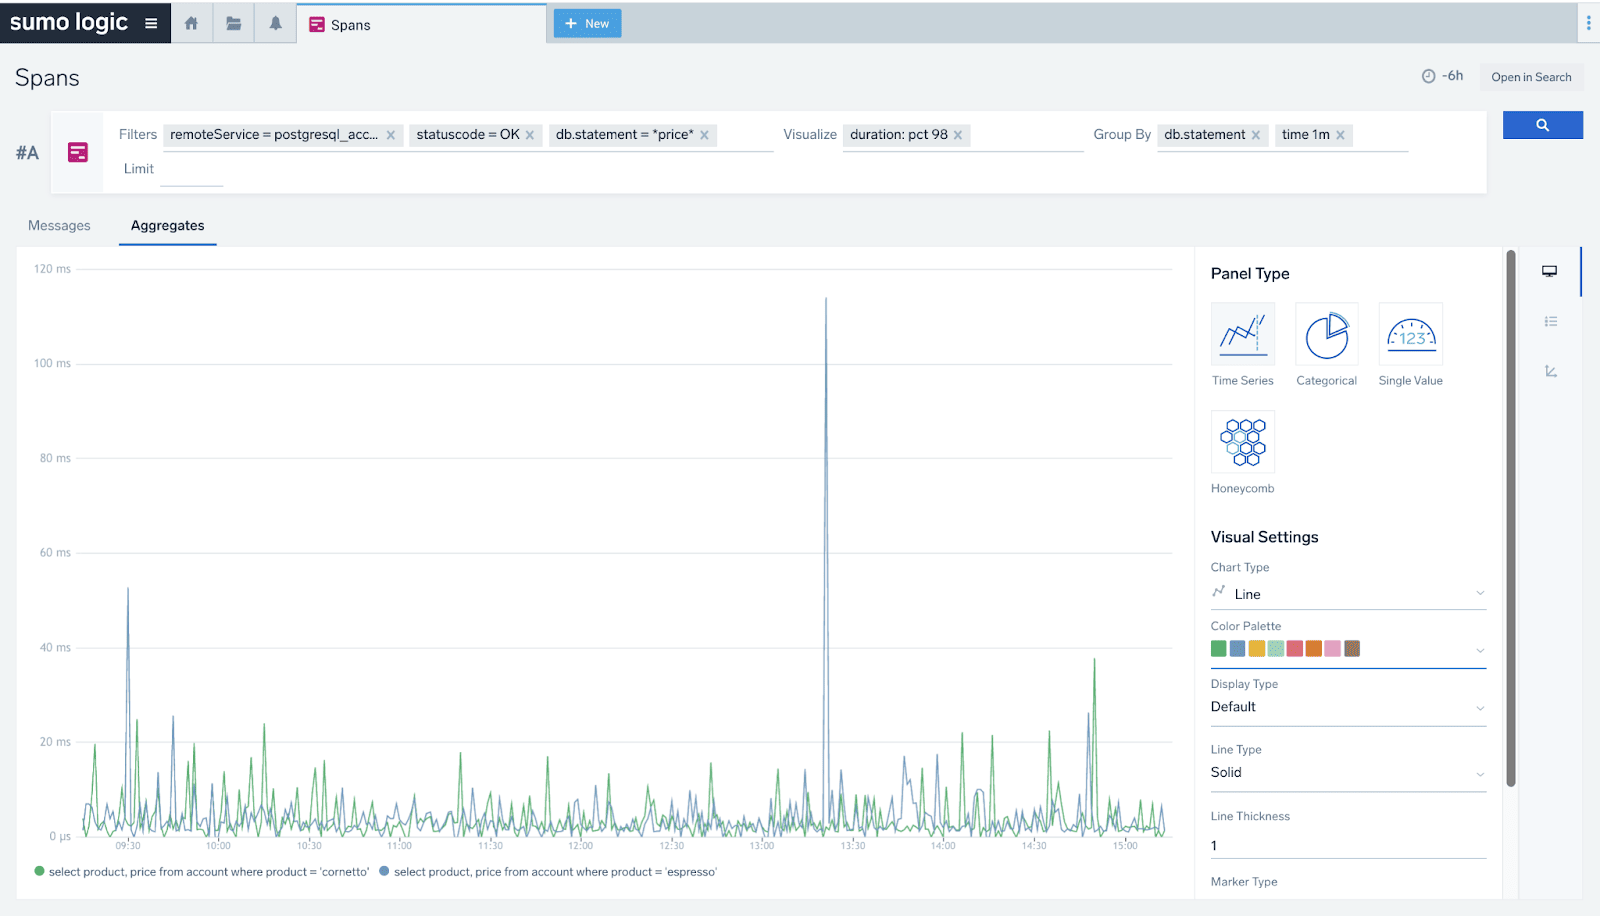
You can access this UI directly from the “+New” menu or via a drill down navigation and “Open in” button by selecting the “Spans” link.
As we can see even without direct instrumentation of the database code itself we can get a ton of useful details about the performance and health of databases, just by looking from the perspective of their clients. This user and transaction-centric view, combined with additional metrics and logs coming directly from your database instances provide you a full set of visibility to observe, monitor, and troubleshoot your precious components of application infrastructure — the home of your valuable data.
Reduce downtime and move from reactive to proactive monitoring.
Build, run, and secure modern applications and cloud infrastructures.
Start free trial
Group Product Manager
Besides sailing and horseback riding, Pawel was always passionate about great user experience. He spent many years working hands-on with the biggest IT organizations in the world, understanding their problems and challenges with digital transformation to help them exceed their customers expectations by building monitoring and observability products that win the market. Pawel joined Sumo in summer 2019 and is busy since then with extending our platform to cover APM/tracing use cases.
More posts by Pawel Brzoska.

No credit card required. Up and running in minutes.
More than 2,100 enterprises around the world rely on Sumo Logic to build, run, and secure their modern applications and cloud infrastructures.
