
2022 Gartner® Magic Quadrant™ SIEM
Get the report
MoreTrusted by thousands of customers globally.
Browse our library of ebooks, briefs, reports, case studies, webinars & more.
July 29, 2021
In one of my previous blogs I explained how important it is for a modern observability platform to provide “the observers” full, flexible access to all raw telemetry. Observability’s promise to find unknown unknowns relied directly on the ability of fast, powerful and multidimensional high-cardinality analysis of raw data, to uncover previously unknown patterns that have not yet been visualized as a metric, dashboard panel or an alert or anomaly event.
Equally important is a common way to access all telemetry types in the form of traces, metrics and logs. As announced in the blog mentioned above, we are really excited about the adoption and use of our Sumo Logic Query Language (SLQL), a powerful and unique capability that DevOps and SRE teams use to accelerate query building (and sharing) by doing it “as code,” with a standard format across logs and application performance tracing data. This common language simplifies onboarding for new team members, and facilitates collaboration for fast and flexible data interrogation to derive answers more quickly.
And, because Span Analytics has no cardinality limits, and operates in a “schema on read” manner, you can always find and query your full-fidelity custom data immediately after adding it to spans!
But what about less experienced or less technical observers… those who may not be familiar with the SLQL?
We know that “observers are everywhere,” and this is an important audience, so we are excited to introduce a brand new experience we built to help data exploration and query creation for less technical users - our new Span Analytics UI,
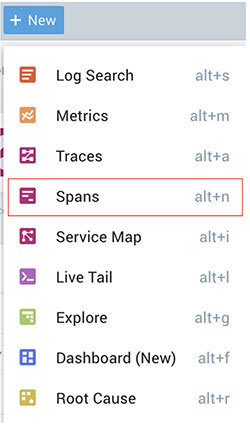
You can find this new capability in the “New” menu of your Sumo Logic interface, or call it directly with Alt-n (Option-n on Mac OS). It brings up a UI where you can immediately start building your analysis query just using your mouse and without any experience with query syntax or how your data looks like.
Of course, before you can see results from these queries you will need to have some distributed tracing data in Sumo Logic already. If the only thing you see is a welcome screen, please ask your Sumo Logic admin to take a look at how to get started with OpenTelemetry distributed tracing. If that doesn’t work, contact your customer success manager for assistance.
If you already know what you are looking for, you can immediately start building your query using the “filter” and “visualise” boxes at the top.
You can also just hit the blue search button, without any conditions, to get a glimpse of the last few minutes of your data set.
On the left, you’ll see a “facets” panel that will break down all existing, built-in and custom span tags for you. It will also show the top 10 most frequent values. You can also search through these fields and their values with a dialog provided at the top of the panel. Then, you can start building your query simply by clicking on the real data values in the fields shown.
Let’s go over two examples of how this helps observers quickly get value from their data. To start, let’s see how much easier it is to now perform analysis similar to what we described in our previous blog. In this case, we would like to compare the performance of different release versions we currently have in the staging environment. We will do this by graphing the 95 percentile of latency of our microservice in function of time.
To do that, go to the “filter” box or “facets” list, find the appropriate service in the dropdown and select it. Then select to visualize duration’s 95th percentile and pick a group by time and assemblyVersion custom tag that carries version information. That’s it!
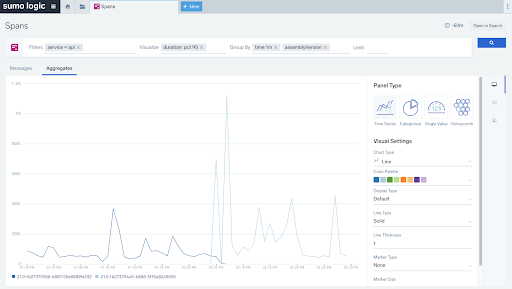
You can also customize your chart by picking different visualization types and colors…
Next, let’s see how to find the distribution of different HTTP errors among our services. Not as a timeseries, just a pie chart to find which service and status code are most common.
Here is the simple query we used to visualize that data:
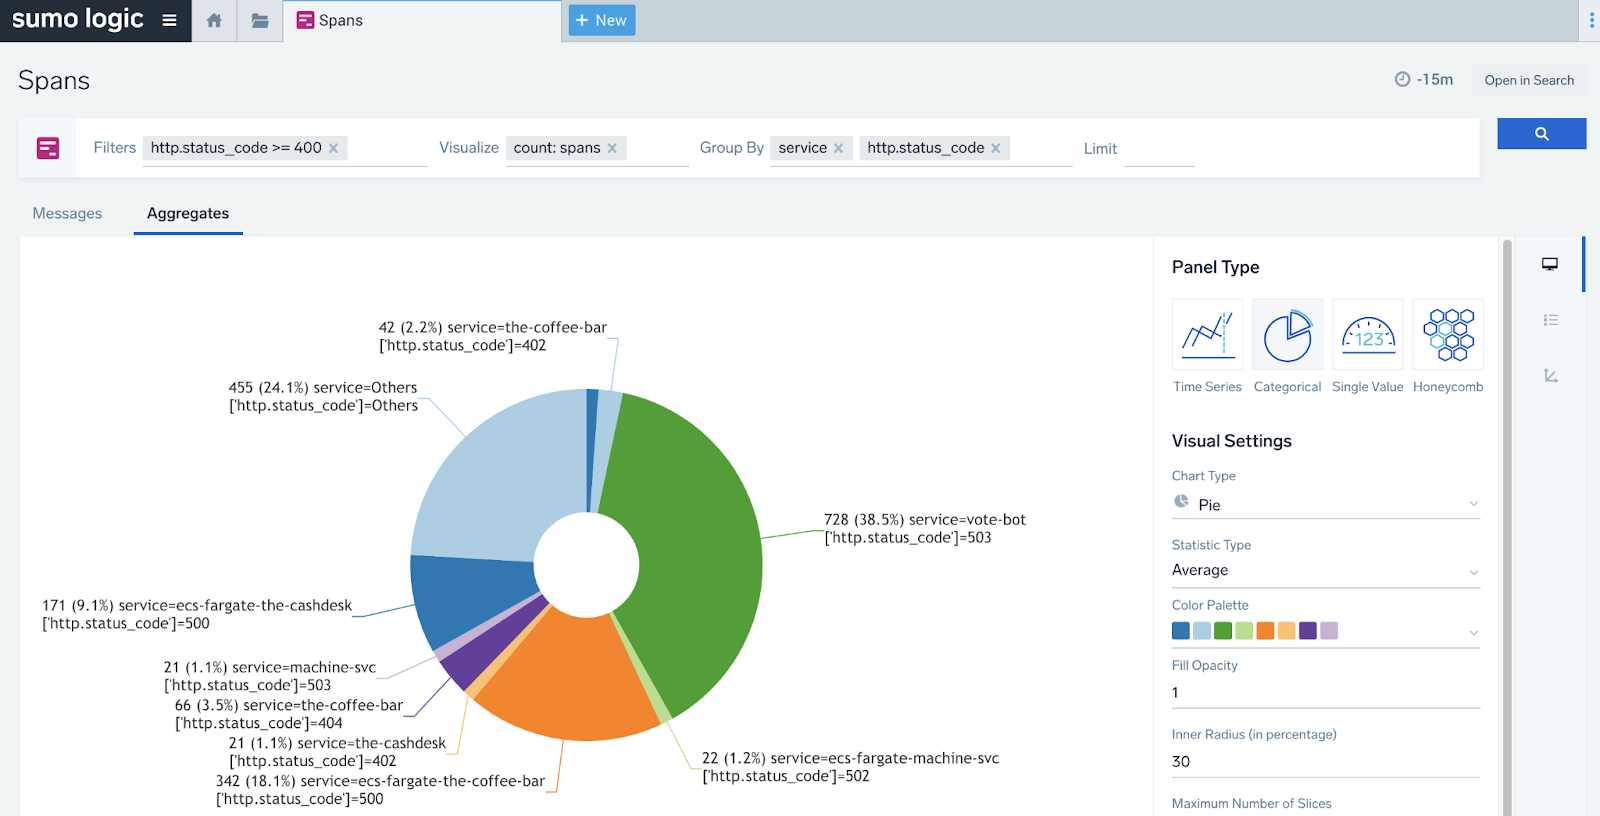
It’s now easier than ever to drill down into the information you care about. Note that our query includes only spans with codes from 4xx and 5xx ranges and visualizes the count of such spans, broken down by two dimensions: service and status code. Easy!
The number of cases you can realise with this is unlimited. In addition to above examples, you can aggregate and visualize the content of custom metrics in your spans, and filter and breakdown by any field, including custom tags. These can all be presented in any of 4 available chart visualisations.
If any further query customisation is required, you can always click “open in search” to edit your query “as code,” making it a great place to start queries in a way that still allows further technical refinement.
As systems get more complex to manage, providing an amazing observer experience that works for users of all technical ability is important to us. If you would like to learn more about Span Analytics:
please refer to our documentation or
find us in #sumo-tracing Slack channel on Sumo Dojo (customers only) or
use the chat icon in the bottom right corner of your screen to reach out to us.
We are always looking for feedback and suggestions for the future. One of things we are working on currently is a possibility to pin results of above queries to the dashboard, so stay tuned!
And, if you are new to APM or tracing in Sumo, make sure to take a look at this intro video, read this blog and get started here!
Reduce downtime and move from reactive to proactive monitoring.
Build, run, and secure modern applications and cloud infrastructures.
Start free trial
Group Product Manager
Besides sailing and horseback riding, Pawel was always passionate about great user experience. He spent many years working hands-on with the biggest IT organizations in the world, understanding their problems and challenges with digital transformation to help them exceed their customers expectations by building monitoring and observability products that win the market. Pawel joined Sumo in summer 2019 and is busy since then with extending our platform to cover APM/tracing use cases.
More posts by Pawel Brzoska.

No credit card required. Up and running in minutes.
More than 2,100 enterprises around the world rely on Sumo Logic to build, run, and secure their modern applications and cloud infrastructures.
