Get the report
MoreApril 11, 2023

As an SRE putting out fires all day, it’s nice to get a good night’s sleep. But there are times when that PagerDuty alert goes off in the middle of the night, forcing you to leap into action to fix a high-priority issue. This is where having the best log analytics tool is critical to easily search and query the log data, perform deep-dive troubleshooting and analysis and quickly come to a resolution.
Sumo Logic recently released new features specific to our log analytics search and query functionality, all designed to help engineers like you be more efficient in issue resolution.
So let’s imagine that dreaded 3 am PagerDuty alert. You rub the sleep out of your eyes, shuffle to your laptop and log into Sumo Logic. You review the dashboard and quickly identify the logs with the issue.
Opening the saved search, you remember the query is very long and gets cut off in the window making it tedious to validate. But a recent update has made the query editor extended, letting you see long query strings so it is easier to validate that the query is still correct - nice!
Querying efficiency is improved by letting you update the default partition where log data is ingested by adding “_index=sumologic_default” to the partition. This new function makes that log data more referenceable without having to query for an empty index, resulting in one less step to your troubleshooting process.

With the source of the logs updated to the new index, you can run a quick search and look for errors by filtering for (“Error”, “error”). You see that Sumo Logic now auto-completes the closed parenthesis and quotes so you don’t have to worry about something so trivial breaking the query.
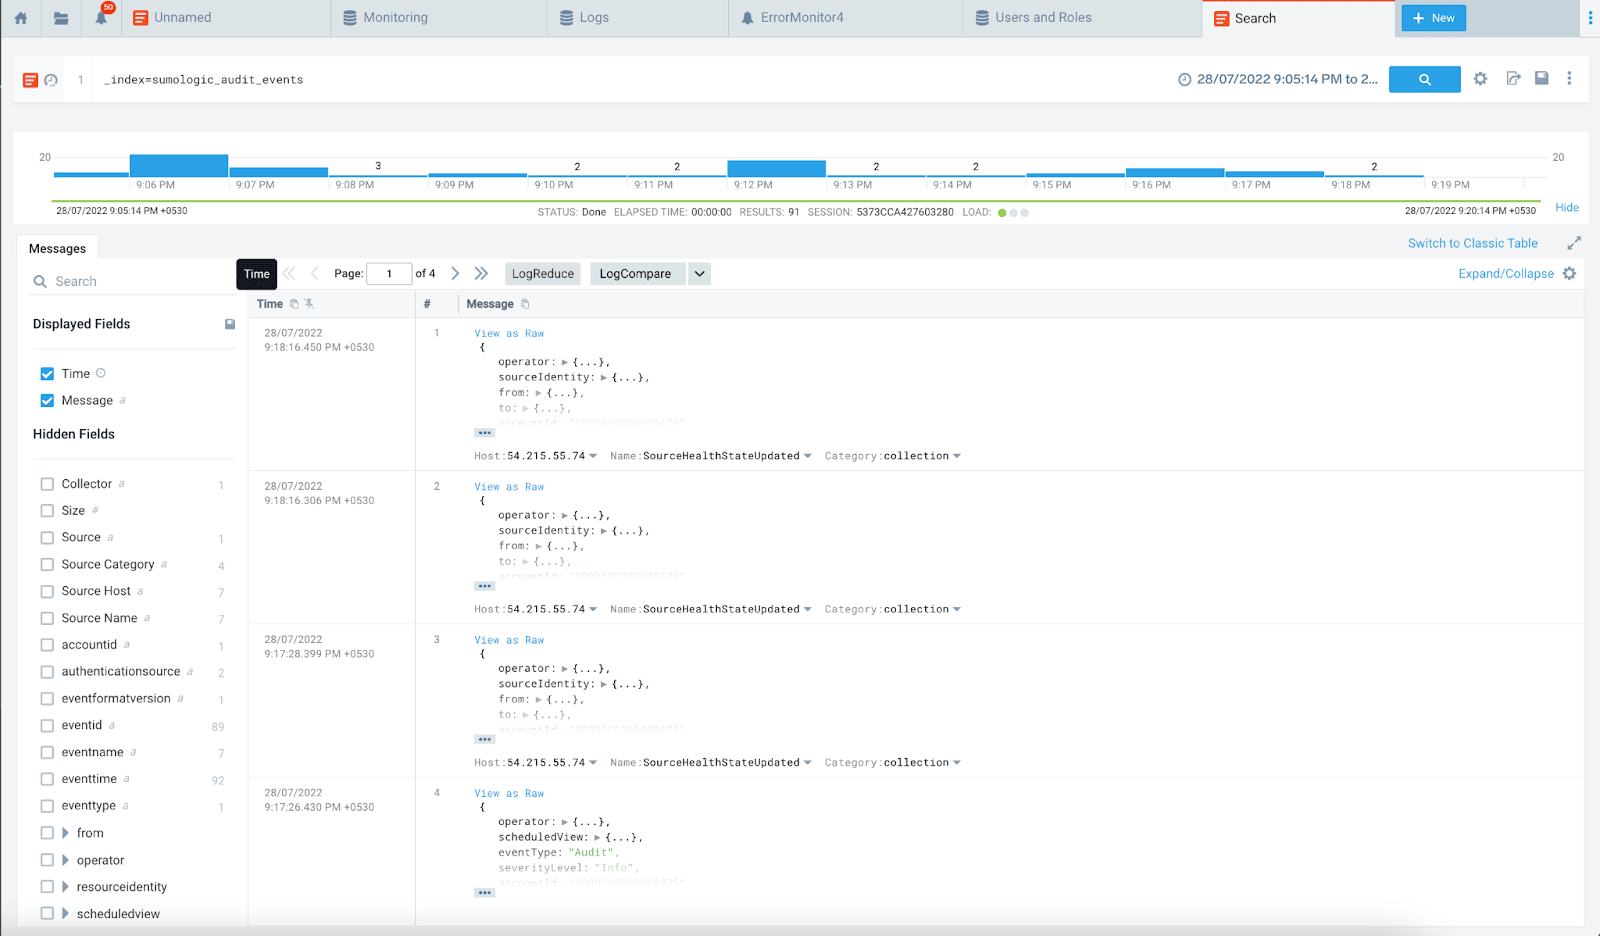
While this query runs, you open another tab to run a second query on JSON logs. When results are displayed in the Messages tab, you can customize this table by pinning a specific column in the table to get better analytics visibility and faster issue analysis.

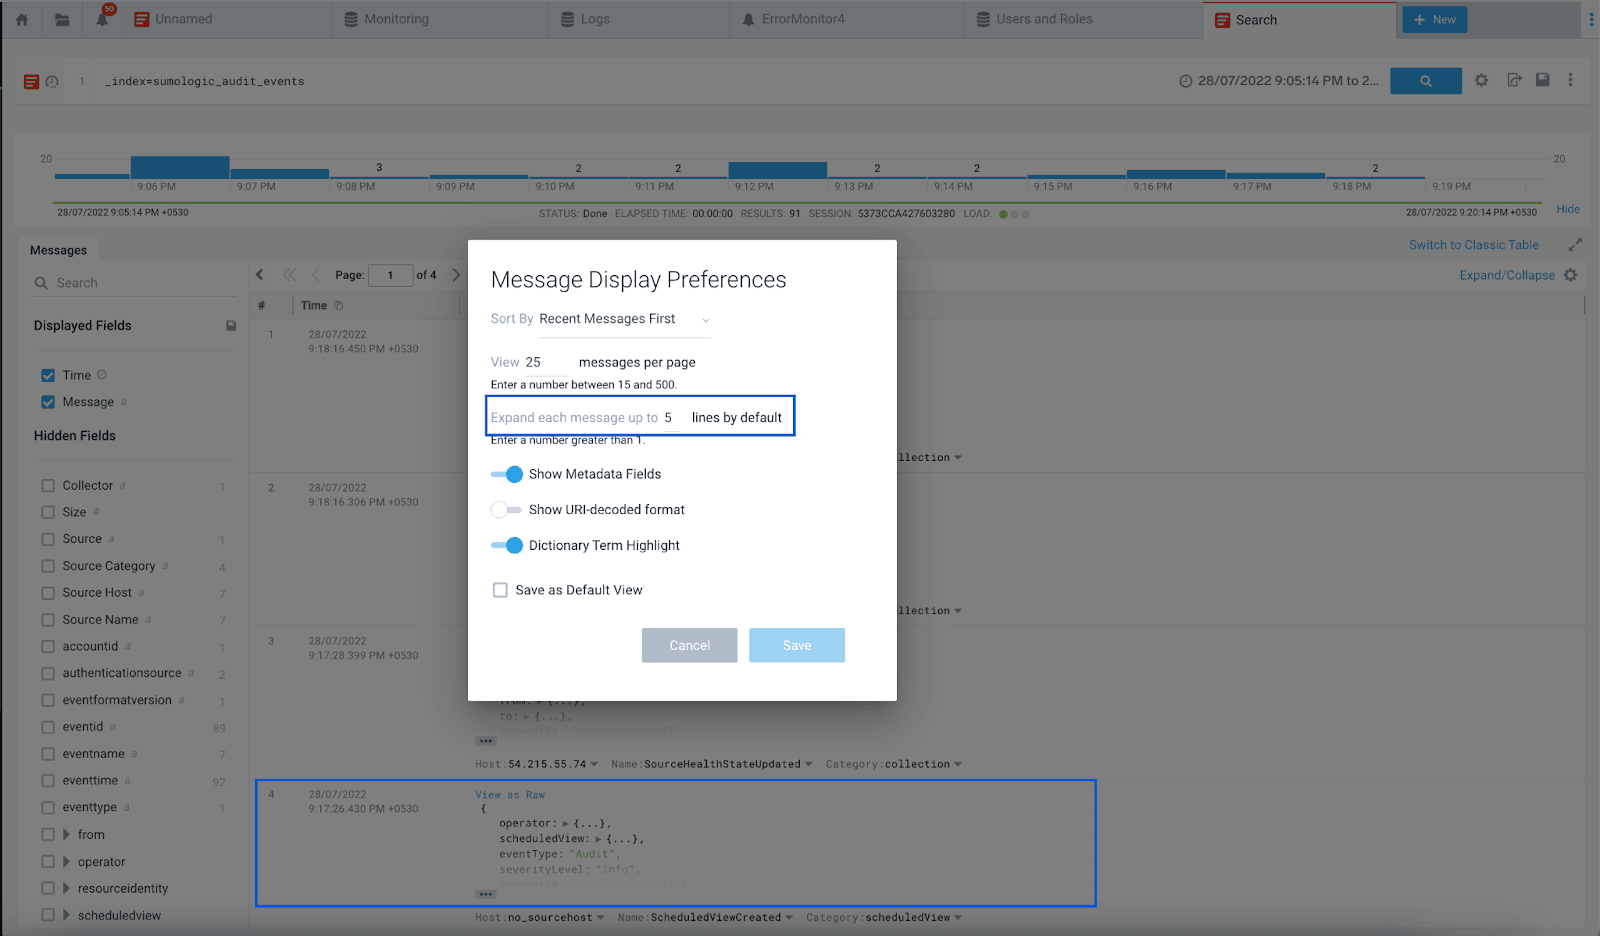
Plus, since query results in the Messages tab typically default to the first ten lines, you can expand to show all JSON rows to get full visibility of the query results to have all information easily available during the troubleshooting process.

After finding the root cause of the issue and fixing the problem, you click “add to dashboard from results” which creates a new panel and adds it to the dashboard for ongoing monitoring.
The clock now reads 3:15 am. Thanks to Sumo Logic, there’s still plenty of time to sleep and be ready for the upcoming work day.
Be sure to check out the release notes to learn how these new log search and query features help you resolve application reliability issues faster, so you can get a good night’s rest.
Reduce downtime and move from reactive to proactive monitoring.
Build, run, and secure modern applications and cloud infrastructures.
Start free trial