Get the report
MoreMarch 11, 2021
Over a year ago we decided to invest heavily in Application Observability, understanding the modern observability platform must unite logs, metrics, and traces in one analytics layer to better serve reliability use cases. We have also advocated a modern trend to acquire tracing data via open source industry standards like OpenTelemetry without vendor lock-in. The importance of tracing data as an observability signal stems from the fact that it allows you to observe your end-to-end lifetime of user transactions, as it travels across tiers of your application, microservices, serverless functions, gateways, etc. From all observability signals, traces are closest to the end-users and in the best way reflect their business transactions flow through your application infrastructure. It is quite natural that in such cases when the traces do represent real user transactions, the quest for looking for the problem root cause sooner or later will turn its focus to the very beginning of such a transaction, that is beyond the typical domain of site reliability engineer: the end-user’s client - the web browser.
We very often forget that there’s a myriad of dimensions that affect the overall end-user experience. Not only backend site reliability and performance is important. That’s the foundation and the main area of SRE expertise, the realm where most of our efforts go to - to improve how our application backend cloud infrastructure is performing. But the end-user will not feel these improvements if we won't ensure that the frontend of our application - the webpage they’re executing at their browser is also performant, optimized for different browsers and locations, that it can get transferred to their end in a short time even during poor connectivity and execute well and fast in their browser type and version.
We are proud to announce that Sumo Logic extends its tracing visibility to the browser. We can gather full information about load, execution, and render of your JavaScript (React, Angular, etc) applications and attach this information to end-to-end trace modeling full browser-to-database performance of every user transaction in real-time, with no sampling. This data is gathered directly from your end-user devices and displayed as individual spans, starting with each user trace reflecting its request journey from the client throughout the whole application and back. All collected data is OpenTelemetry compatible and uses no proprietary vendor code to achieve its result when collecting required data.
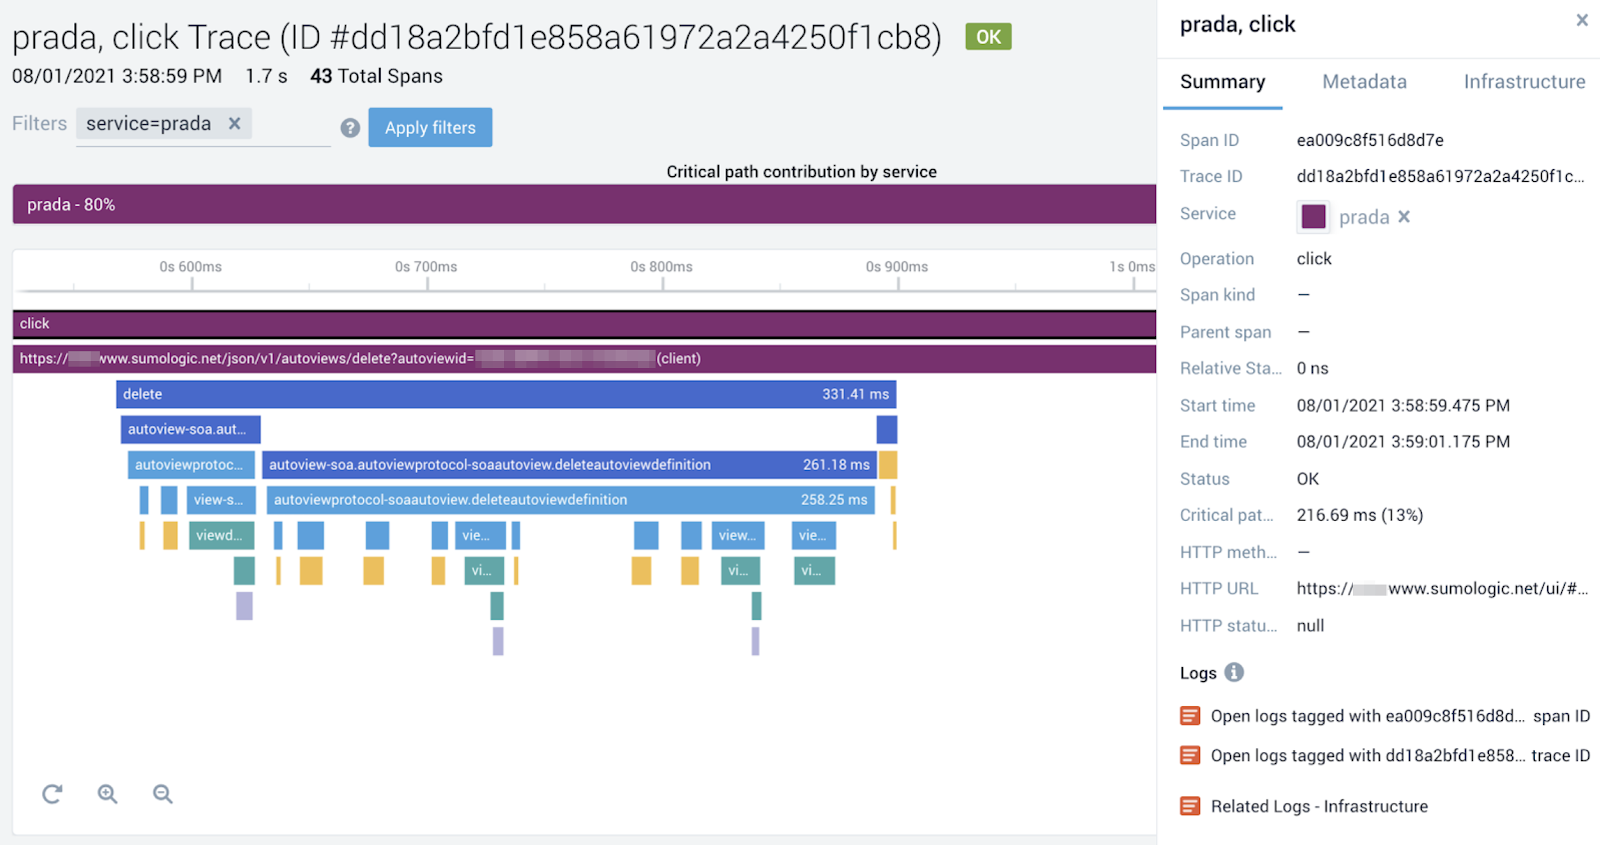
Let’s imagine we are troubleshooting a slow user transaction: the user was trying to execute a certain action in the application UI and it took a bit longer than expected. We want to understand how that transaction looked like from end-to-end and what happened. Fortunately, we have Sumo Logic observability and we have a full record of this transaction:

The purple “Prada” service represents the code run in the browser. As we can see, the user here clicks in the UI to perform “delete the Auto View” transaction and requests a series of events in the backend (blue, green, and yellow parts representing various backend microservices taking part in the transaction). We can clearly understand how much the user was waiting for the request to complete in the backend, what parts of the application infrastructure were part of the call and what was their contribution to overall end to end time. Equally, we can understand how much did it take for the request to reach our application frontend, how much for the response to get back to the user, and how long it took the browser to complete the whole transaction.

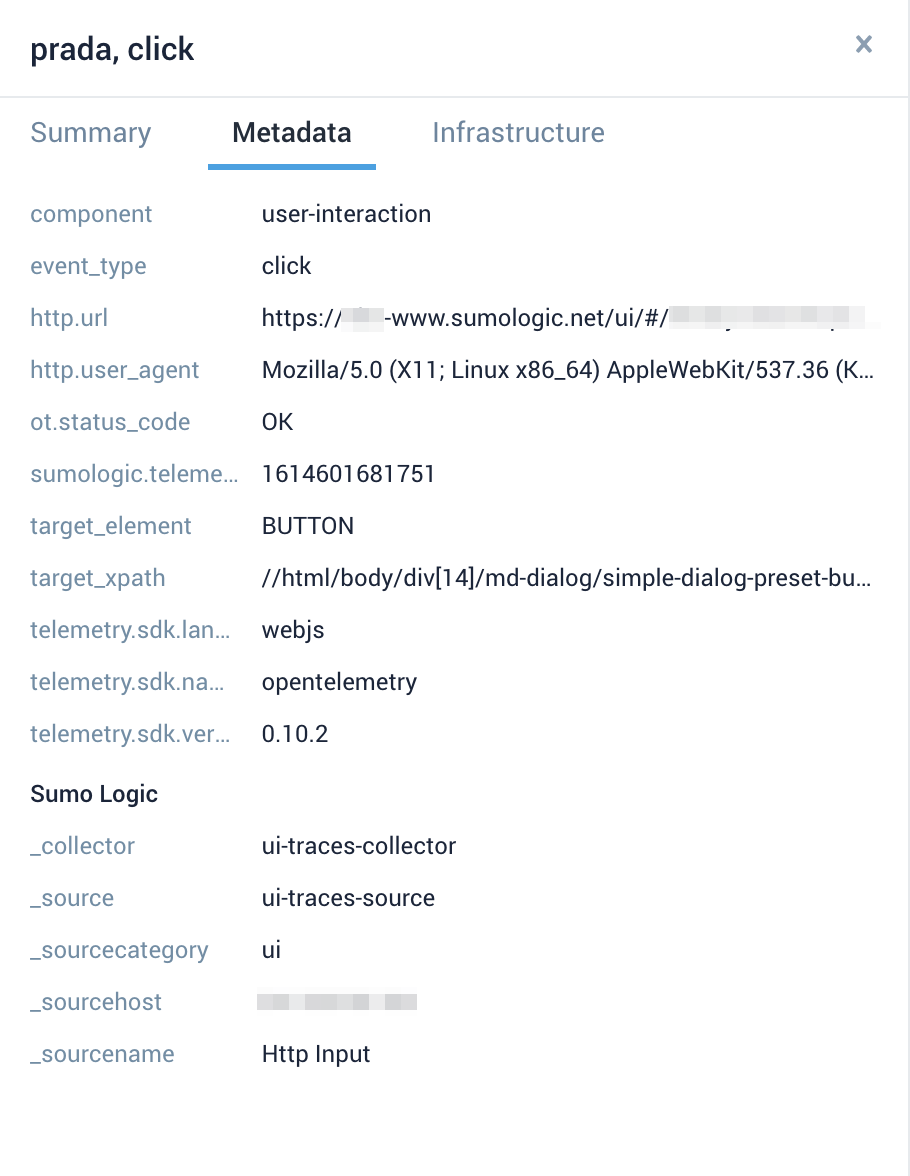
We also gather full details about the end-user device and browser. Let’s take a closer look into the first span representing the “Click” operation and investigate collected metadata.
In addition to the user-agent carrying information mentioned above, we also have all the details about the url that was used, the target element, and its Xpath indicating the particular component of the page (button in this case) that was clicked.
All of that helps us to get full insight into what happened in the user’s browser and how that translated into the HTTP network request and then a follow-up chain of spans and requests in the backend.
Data is sent from the user browsers directly to Sumo Logic cloud (although an optional collector at customer premises is also supported) and we automatically adjust any major clock skewness at the user browser, so you can have a guarantee that it will always match with the backend part of the trace.
I am sure this will already give you a lot of visibility into the real user experience of your applications and help better troubleshoot problems in your applications. This kind of end to end visibility is something that gives great value to teams responsible for running and operating business-critical, customer-facing web apps. If you would like to try these new capabilities, contact your account team or find us in #sumo-tracing on Sumo Dojo slack channel or (if you’re not yet a customer) - contact us using the chat button in the bottom-right corner of your browser.
We will be soon expanding our cloud APM capabilities by aggregating the above data into metrics, dashboards and providing multi-dimensional analysis by geographical locations, browser, and OS types, measuring and visualizing on dashboards many different aspects of web page load events. Stay tuned!
Reduce downtime and move from reactive to proactive monitoring.
Build, run, and secure modern applications and cloud infrastructures.
Start free trial