Get the report
MoreOctober 9, 2020
This week Sumo Logic announced our new Observability Suite, which included the general availability of our distributed tracing capabilities as part of our Microservices Observability solution. This new solution provides end-to-end visibility into user transactions across services, as well as seamless integration into performance metrics and logs to accelerate issue resolution and root-cause analysis. In this blog, we’ll explore the new solution in detail.
Almost everyone these days is moving or architecting new applications by use of microservices in cloud-native environments. That means breaking big monolith applications into a bunch of smaller interconnected modules. With this approach, it is possible to innovate much faster, but makes our environments equally more complex and hard to troubleshoot. In modern cloud-native environments, it is important to track how transactions flow across tiers, and components. In particular, It is more important to monitor the health, dependencies and behaviors of micro components rather than depending on deep code instrumentation, code profiling, or stack dumps. That's how distributed tracing was born in projects like Google’s Dapper or Facebook’s Canopy since application performance management (cloud APM) tools at that time were not able to deal with the scale and complexity of these apps. APM tooling is certainly more mature today and fully supports cloud-native environments, but those tools do this with a lot more complexity and at a much higher cost than expected by most customers. The higher costs are not only licensing and maintenance costs, but also the opportunity costs of vendor lock-in. That’s why commoditized, lightweight, and free open standard instrumentation is the first choice for many customers when thinking about modern cloud-native application observability. Unfortunately, despite the potential of the new frameworks, the supporting analytics of that data (the backend) are still not delivering on their promise.
We’ve also had similar observations and conclusions at Sumo Logic when implementing distributed tracing for our own site reliability needs, and found out (as we are an observability company ourselves) that we can do better. It all started with a small but compelling hackathon project last year which blossomed into a full investment in a new product area. Now it is finally time to share the results of that journey with all our customer base -- the beta of our new Distributed Transaction Tracing solution. This is the first step in what we aim to be the best open tracing standards analytics backend in the industry:
Sumo Logic Tracing, provides customers best in class cloud-native transactional intelligence for distributed business workflows, by combining telemetry from traces, logs, and metrics in the context of real-time automatically tracked application topology. All telemetry signals are fully integrated to provide a seamless end-to-end experience during the process of managing and responding to production incidents and to reduce downtime by streamlining root cause analysis. Sumo Logic Tracing supports the OpenTelemetry standard as well as other legacy open standards for tracing and leverages open source componentry from the Cloud Native Computing Foundation (CNCF) to collect distributed tracing data.
With Sumo Logic Tracing, you get:
- help and support for already existing or new adoption of the tracing open standard of your choice (e.g. OpenTelemetry, OpenTracing, OpenCensus), so you can enable transactional visibility without vendor lock-in.
- the ability to ingest natively any open standard compatible tracing format to the platform through the Sumo Logic Kubernetes collector or the OpenTelemetry collector, allowing you to analyze all observability signals in context.

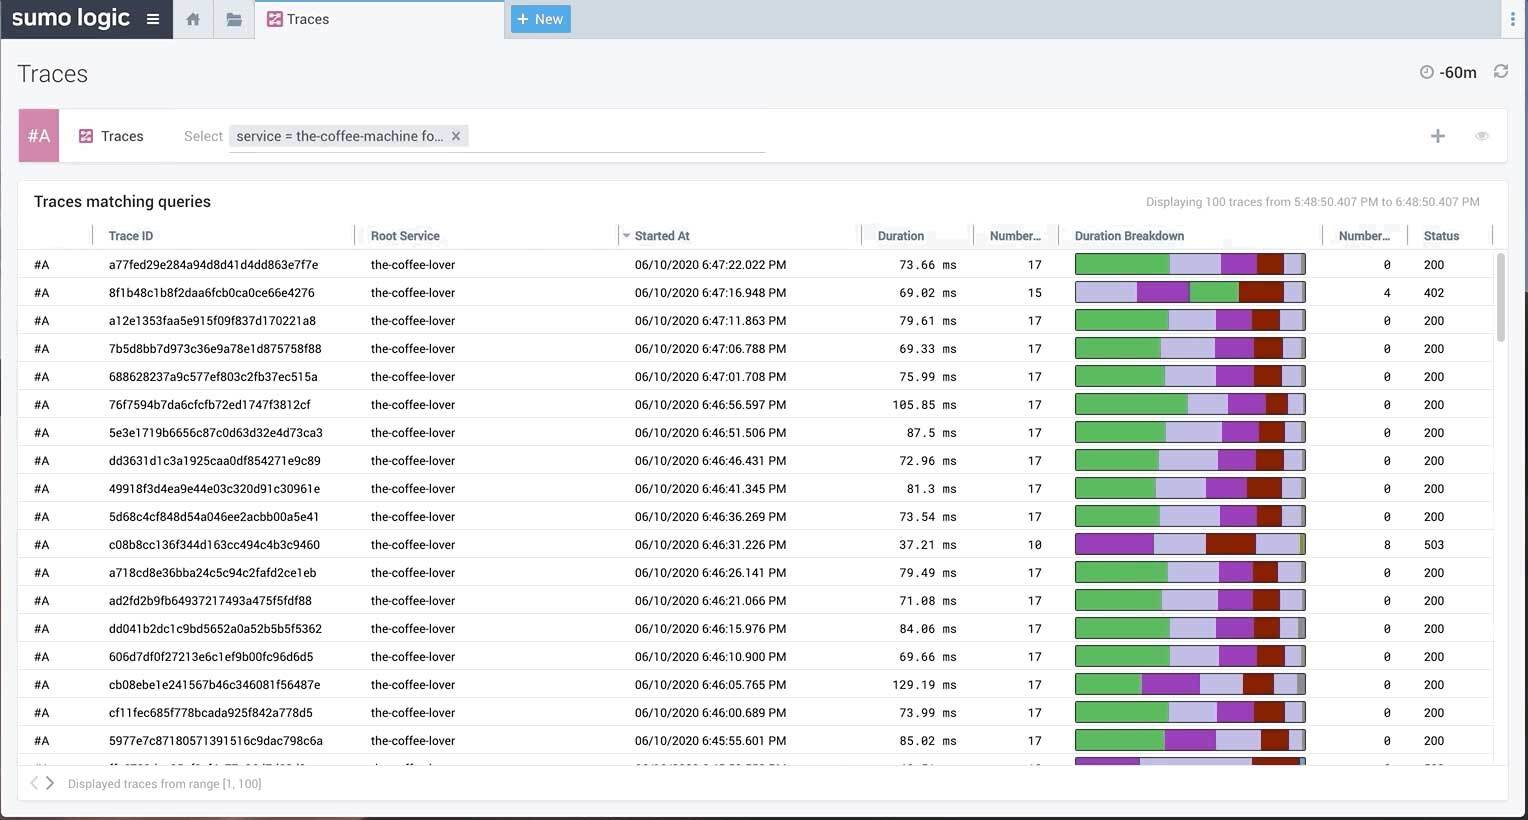
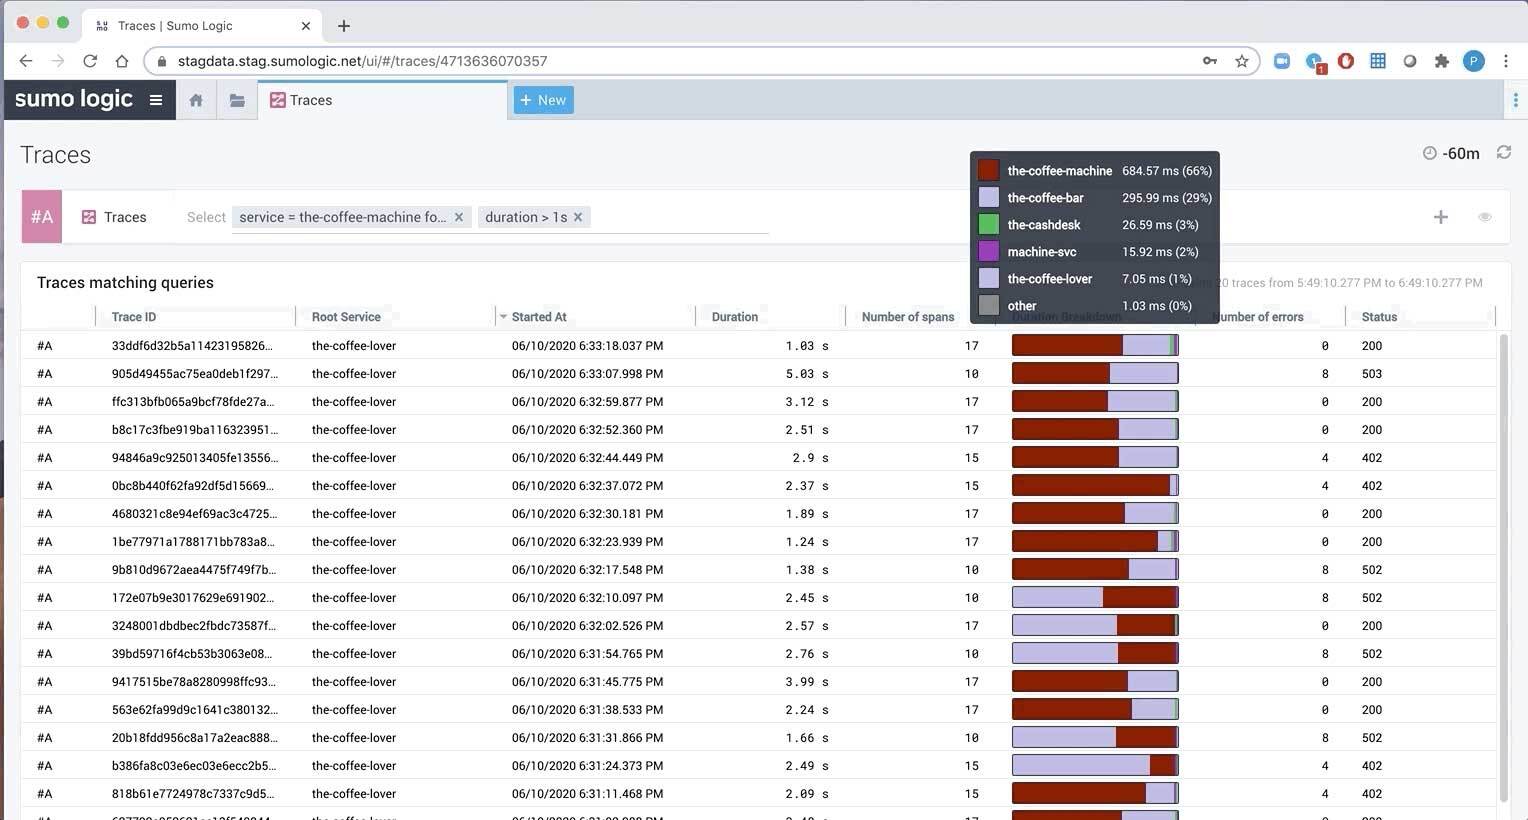
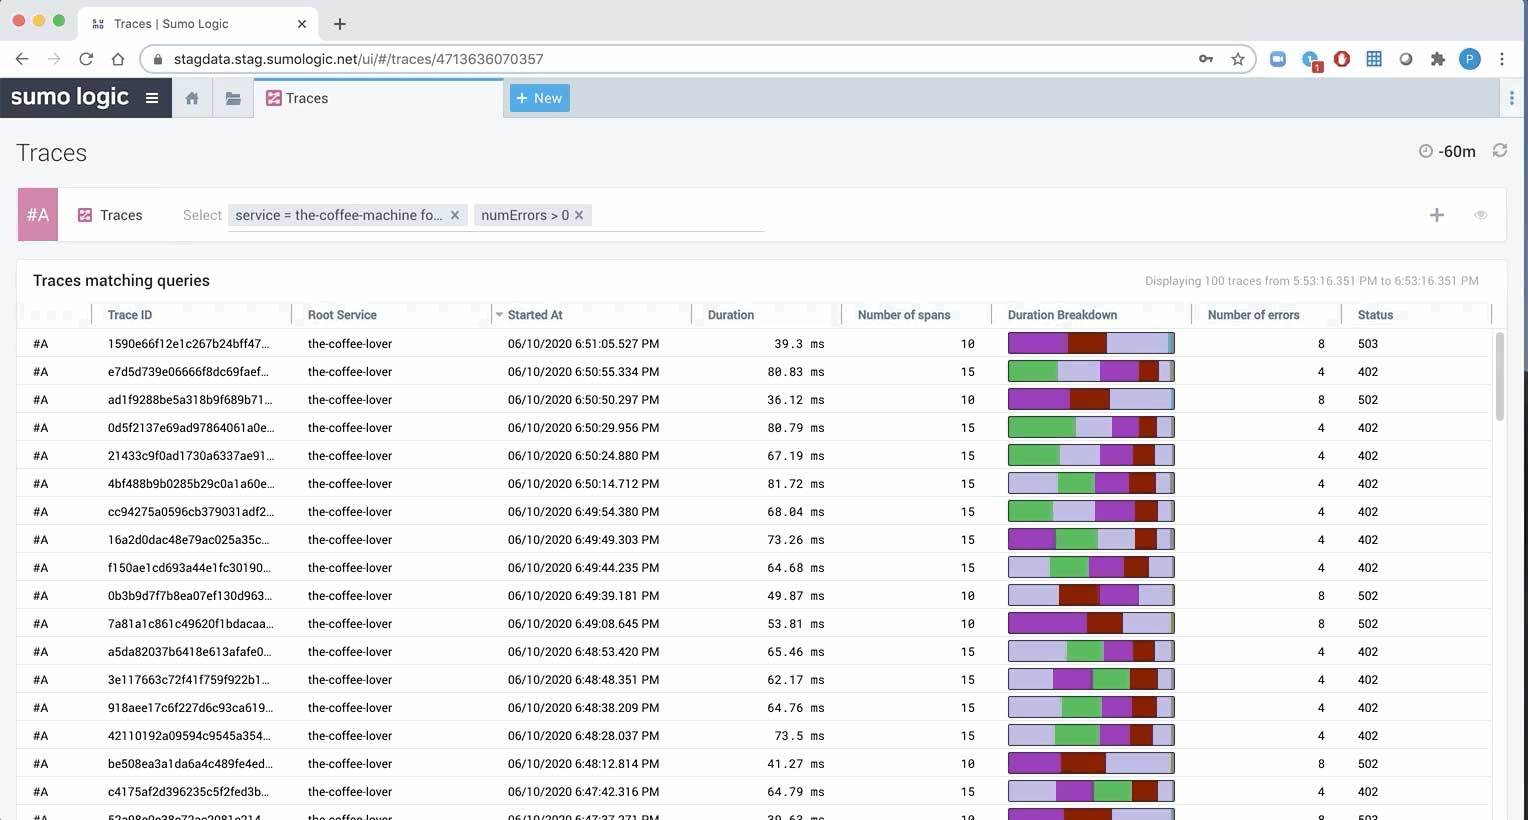
- the ability to search for traces of interesting transactions, so that you can find long-running or faulty transactions.

- the capability to drill down to any specific trace to better understand timing relations, the journey through the application infrastructure, full metadata info, error details, metrics-based infrastructure health info, and more.

- Finally, the functionality to drill down to logs or infrastructure KPIs and easily pinpoint a root cause of the problem with all the important telemetry data at hand.
This is only the beginning. We are working hard to develop new and exciting capabilities of the Sumo Logic Observability platform to provide an easy view into the health of your microservices, their dependencies, and to extend tracing support to browsers and mobile devices. Stay tuned for more news!
Reduce downtime and move from reactive to proactive monitoring.
Build, run, and secure modern applications and cloud infrastructures.
Start free trial