
2022 Gartner® Magic Quadrant™ SIEM
Get the report
MoreTrusted by thousands of customers globally.
Browse our library of ebooks, briefs, reports, case studies, webinars & more.
April 17, 2023
MySQL, a leading open source database for the past few decades, underpins potentially millions of applications, from tiny prototypes to internet-scale e-commerce solutions. The beauty of MySQL is not only its powerful relational database capabilities but also that it can be scaled up as the application grows.
Why should you care about MySQL performance? Because MySQL is the backbone of many applications, your application performance will be inherently tied to your MySQL database performance. Staying on top of your MySQL monitoring can help you get ahead of issues before your end-users are affected. In addition, you can determine if performance issues are related to poorly written MySQL queries.
Optimizing MySQL’s performance for your environment requires monitoring its logs and metrics. At the very minimum, every MySQL instance produces log files that contain basic errors generated by queries and fatal errors in the system itself. However, even more valuable metrics exist for those looking to assess MySQL performance, reduce bottlenecks and avoid outages. You can expose these metrics manually via a SQL query or automatically via observability platforms and other monitoring tools.
Discover MySQL metrics to track and how you can get started monitoring in minutes with Sumo Logic’s MySQL application, powered by our OpenTelemetry collector.
You should pay attention to three areas when monitoring MySQL:
Server variables are where a MySQL server loads its configuration, including elements like cache sizes and maximum connections. These are important to track, as your system can’t process more requests if you reach these limits, resulting in potential failures.
Sys schema is a series of procedures, functions and views that give you insight into how the MySQL database instance is running. This includes current connections, queries that are being executed, buffer sizes and any existing locks.
Performance schema needs to be explicitly enabled in MySQL, unlike sys and server variables (which are enabled by default). It provides low-level access to all of the metrics that make up the information in the sys schema. If you need more information to get to the bottom of a performance issue, this is where you will look for those extra details. For example, you can see what individual threads are doing here instead of looking at connection and query-level information in the sys schema.
Your connections are the first thing you need to watch for MySQL performance monitoring. A metric called max_used_connections will tell you the maximum number of connections to your server since it was last restarted. (Sumo Logic’s Performance and Resource Metrics Dashboard for MySQL can help you track max connections errors.)
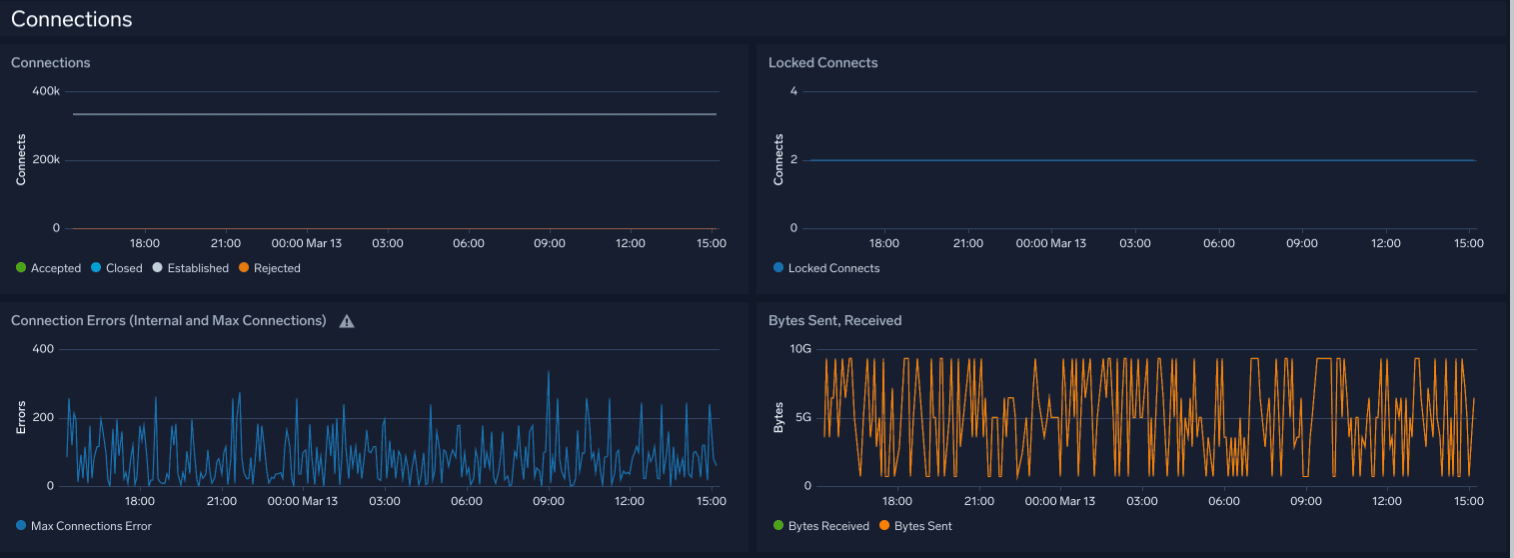
If you want to increase “max_connections,” all you have to do is set a higher value in the server variable – just make sure that the server has enough capacity, since each connection has its own buffers and therefore takes up a little physical RAM.
Also watch a metric called “aborted_connections,” which will show you all the failed attempts to connect to the server. If this number is increasing, it could indicate anything from a bad password to a DoS attack.
To see what your connections are doing in real time, you can watch the active threads — “threads_connected” tells you how many connections are active.
Monitor the number of questions and queries, which may seem similar at first glance.
As the MySQL reference manual defines it, a question is “the number of statements executed by the server,” which “includes only statements sent to the server by clients and not statements executed within stored programs.” Meanwhile, a query includes statements executed within stored programs. For complex transactions, the query number can be drastically higher than the number of questions.
Pay close attention to slow queries.
Slow queries are queries that take ten seconds or more to execute (the default value is ten seconds, per MySQL’s configuration, which can be altered). Excessively slow queries are those that take 15 seconds or more to execute. Out of the box, Sumo Logic offers a dashboard solely focused on slow queries, so you can immediately see which users and hosts are running slow queries and track trends around performance bottlenecks.
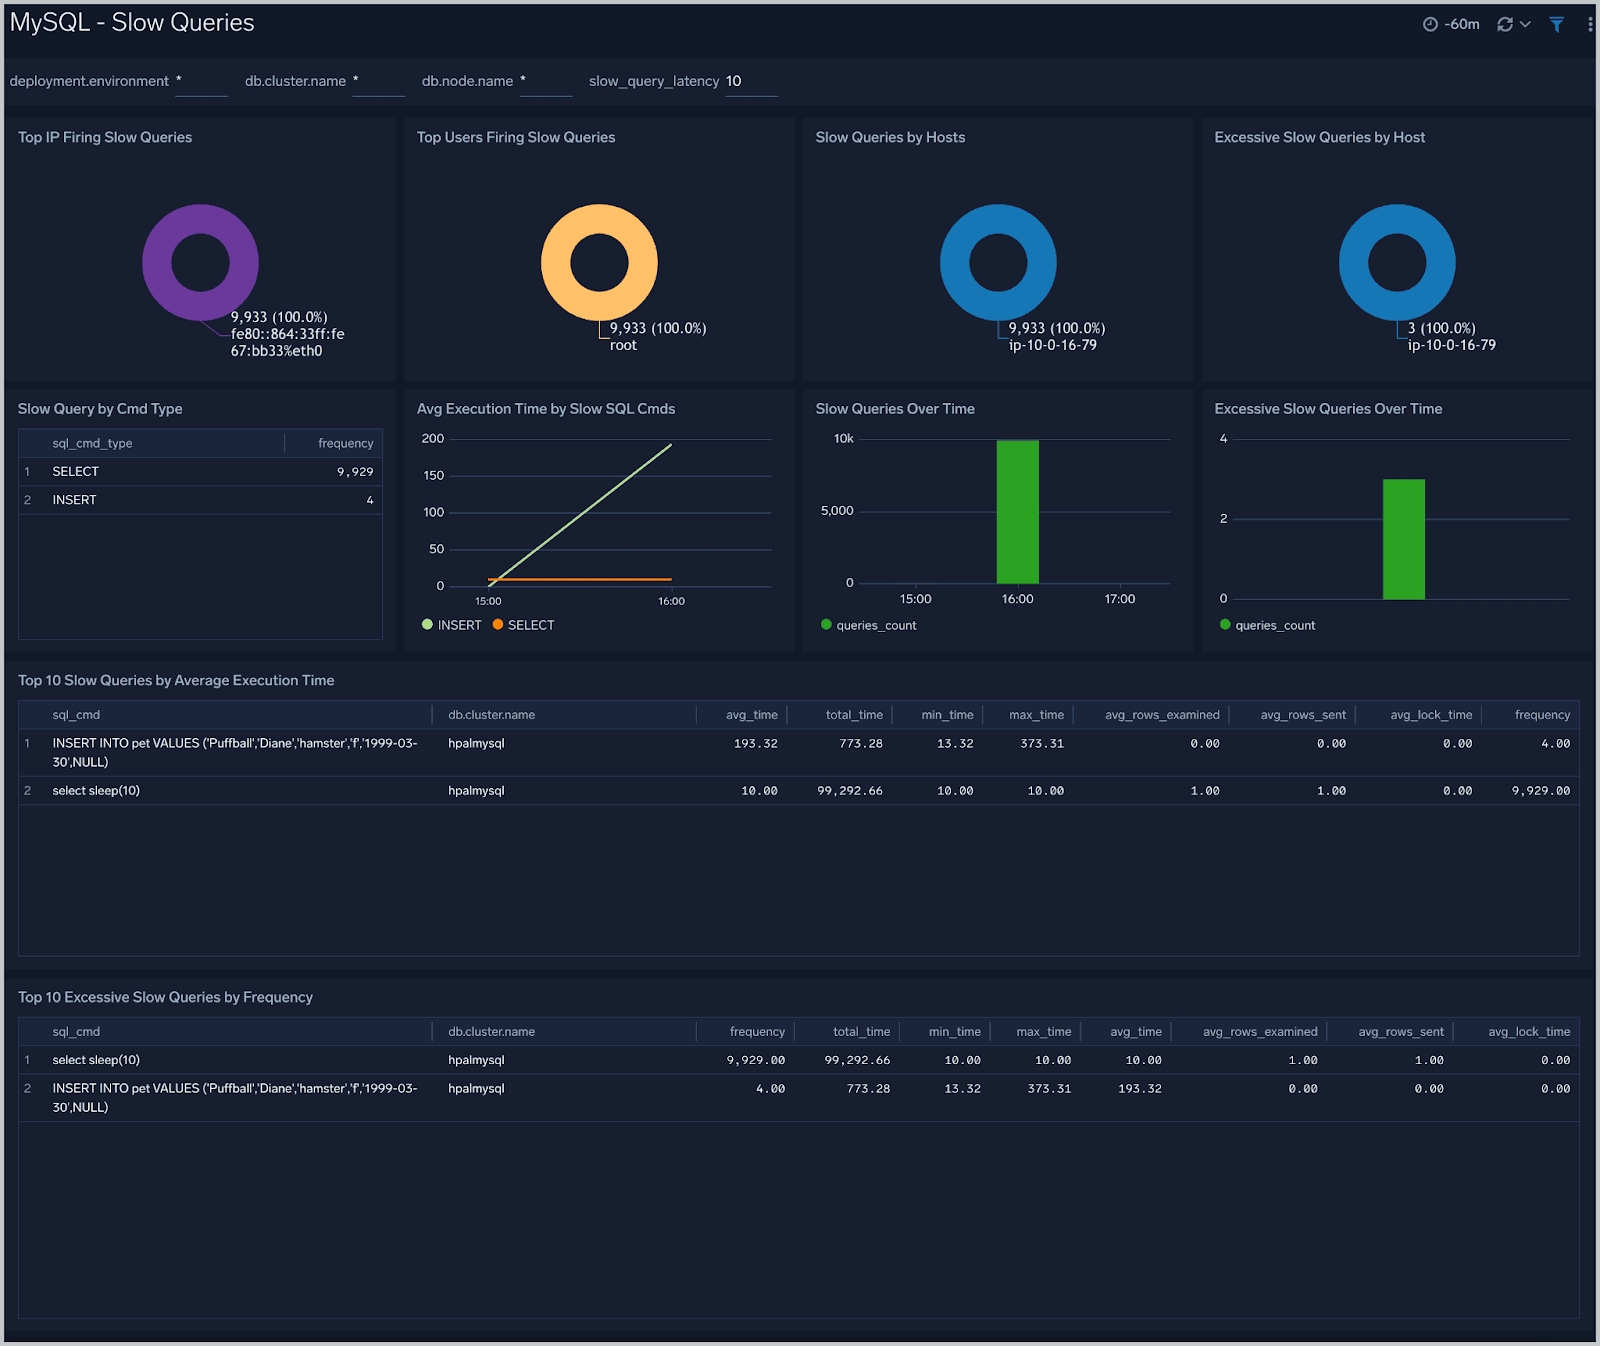
Use the following query within Sumo Logic to see the top ten slow queries by execution time.
db.system=mysql db.cluster.name={{db.cluster.name}} "User@Host"  "Query_time"

| parse regex "(?<query_block># User@Host:[\S\s]+?SET timestamp=\d+;[\S\s]+?;)" multi

| parse regex field=query_block "# User@Host: \S+?\[(?<user>\S*?)\] @ (?<host_name>\S+)\s\[(?<ip_addr>\S*?)\]" nodrop

| parse regex field=query_block "# User@Host: \S+?\[(?<user>\S*?)\] @\s+\[(?<ip_addr>\S*?)\]\s+Id:\s+(?<Id>\d{1,10})" nodrop | parse regex field=query_block "# User@Host: \S+?\[(?<user>\S*?)\] @ (?<host_name>\S+)\s\[(?<ip_addr>\S*?)\]\s+Id:\s+(?<Id>\d{1,10})" | parse regex field=query_block "Schema: (?<schema>(?:\S*|\s)?)\s*Last_errno[\s\S]+?Query_time:\s+(?<query_time>[\d.]*)\s+Lock_time:\s+(?<lock_time>[\d.]*)\s+Rows_sent:\s+(?<rows_sent>[\d.]*)\s+Rows_examined:\s+(?<rows_examined>[\d.]*)\s+Rows_affected:\s+(?<rows_affected>[\d.]*)\s+Rows_read:\s+(?<rows_read>[\d.]*)\n" nodrop | parse regex field=query_block "Schema: (?<schema>(?:\S*|\s)?)\s*Last_errno[\s\S]+?\s+Killed:\s+\d+\n" nodrop | parse regex field=query_block "Query_time:\s+(?<query_time>[\d.]*)\s+Lock_time:\s+(?<lock_time>[\d.]*)\s+Rows_sent:\s+(?<rows_sent>[\d]*)\s+Rows_examined:\s+(?<rows_examined>[\d]*)\s+Rows_affected:\s+(?<rows_affected>[\d]*)\s+" nodrop | parse regex field=query_block "Query_time:\s+(?<query_time>[\d.]*)\s+Lock_time:\s+(?<lock_time>[\d.]*)\s+Rows_sent:\s+(?<rows_sent>[\d]*)\s+Rows_examined:\s+(?<rows_examined>[\d]*)"

| parse regex field=query_block "# Bytes_sent:\s+(?<bytes_sent>\d*)\s+Tmp_tables:\s+(?<tmp_tables>\d*)\s+Tmp_disk_tables:\s+(?<temp_disk_tables>\d*)\s+Tmp_table_sizes:\s+(?<tmp_table_sizes>\d*)\n" nodrop | parse regex field=query_block "# Bytes_sent:\s+(?<bytes_sent>\d*)\n" nodrop | parse regex field=query_block "SET timestamp=(?<set_timestamp>\d*);(?:\\n|\n)(?<sql_cmd>[\s\S]*);" nodrop

| fields -query_block

| avg(query_time)  as avg_time,  sum(query_time)  as total_time,  min(query_time)  as min_time,  max(query_time)  as max_time,  avg(rows_examined)  as avg_rows_examined,  avg(rows_sent)  as avg_rows_sent,  avg(Lock_Time)  as avg_lock_time, count as frequency group  by sql_cmd, db.cluster.name

| sort by avg_time | limit  10
It is also helpful to track how read or write-heavy your database is, so you can make adjustments to buffer sizes or disk types to improve performance. Read-only queries are often recorded under the “com_select” variable, while the queries that normally write are split between “com_insert,” “com_update,” and “com_delete.”
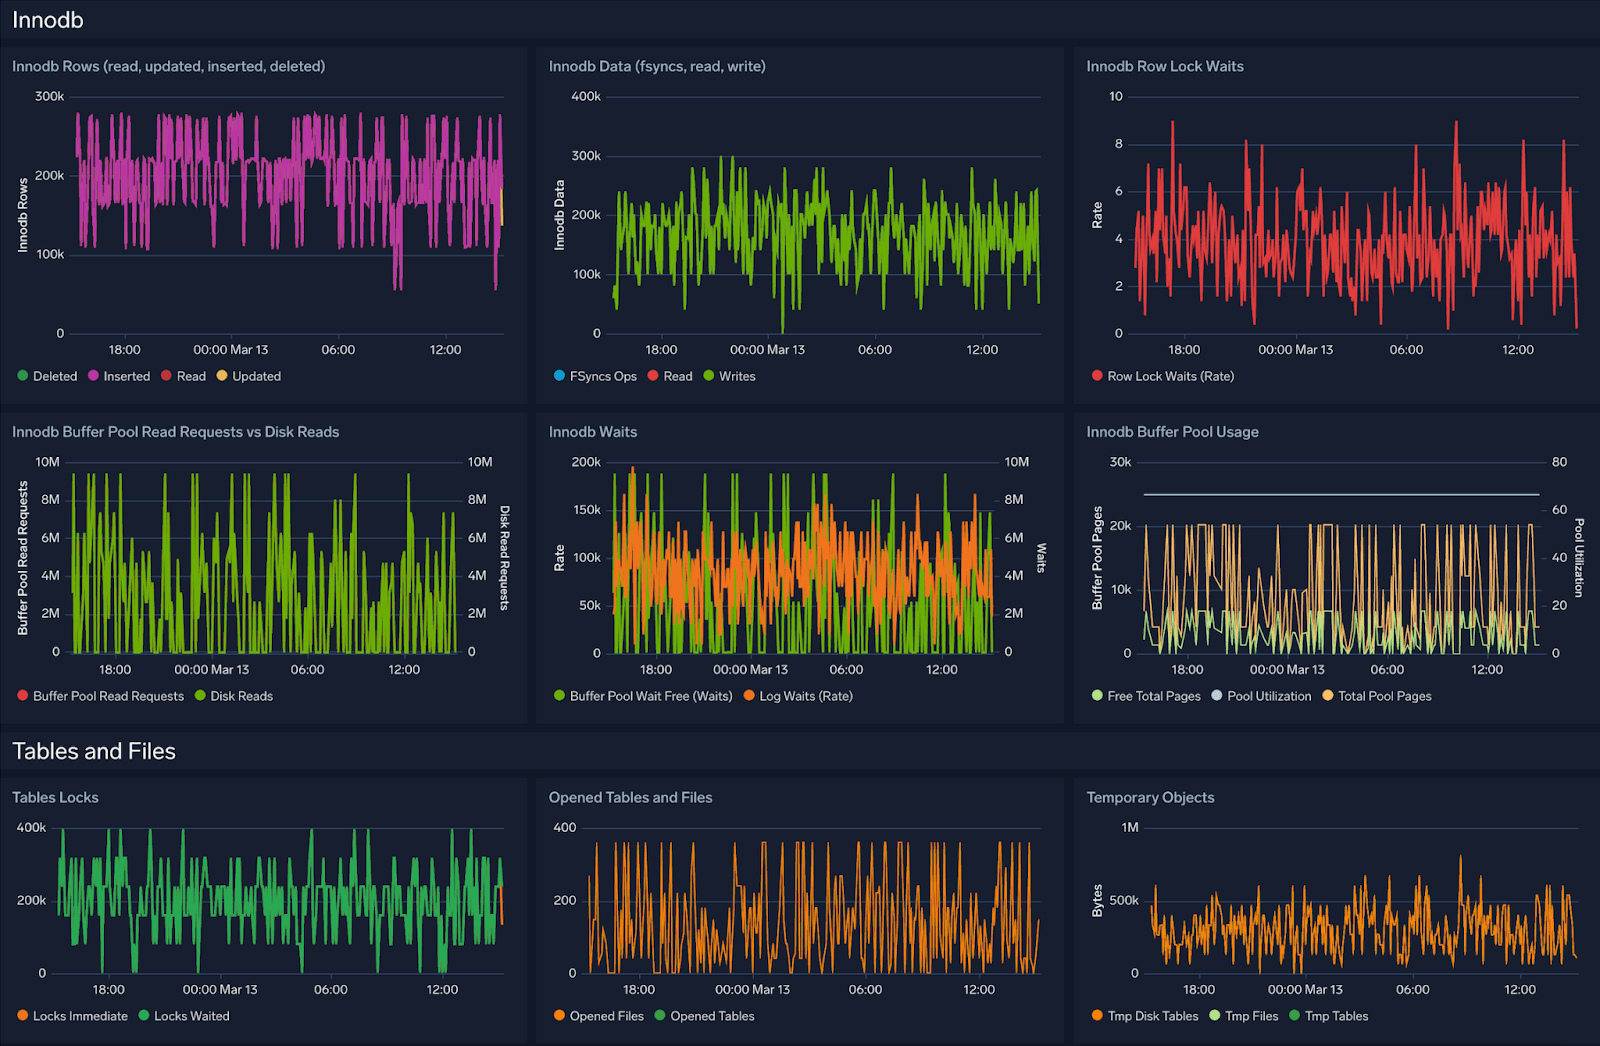
It is also vital to watch how MySQL handles its buffers (MySQL’s term for caches). A good place to start is to configure the buffer size to be about 80% of available memory on a system – assuming that the server is dedicated to MySQL. This will allow for the best overall caching performance by preventing the buffers from writing to swap spaces (which will kill performance just as quickly as not having enough memory allocated in the first place). The InnoDB buffer pool metric “innodb_buffer_pool_size” is often the easiest way to see and update the current value.
Out of the box, Sumo Logic provides an at-a-glance view of InnoDB metrics, including buffer pool utilization.
Learning these metrics is a great way to help you tune the performance of your MySQL instance. However, if you want to resolve MySQL issues before they become problems, you will probably need a MySQL monitoring tool that can offer you insights and deep visibility into your MySQL database performance.
Sumo Logic’s MySQL application can empower your teams to act confidently and begin monitoring MySQL in minutes.
The application offers robust out-of-the-box dashboards, giving you visibility into errors, slow queries, and more. It also reflects our commitment to standardizing on OpenTelemetry, ensuring a vendor-agnostic approach that spares you the headache of leveraging multiple collectors for different telemetry types (one for metrics, one for logs, etc.).
It’s easy. Watch the video below to see how to get started today.
For more information on how to get started, please refer to our technical documentation.
Interested in getting visibility beyond just MySQL, across your entire infrastructure and application components? Don’t fret – Sumo Logic can help you there, too. Check out how it’s easier than ever to bring your mission-critical telemetry into Sumo Logic to monitor your infrastructure thanks to our investments in OTel.
Reduce downtime and move from reactive to proactive monitoring.
Build, run, and secure modern applications and cloud infrastructures.
Start free trial
Senior Product Marketing Manager
Michael is a member of the Observability Product Marketing team at Sumo Logic. Before Sumo Logic, he worked as a PMM at forward-looking technology companies Axon and Fastly. When he's not working with sellers and product managers, Michael enjoys watching reality TV and collecting vintage clothes.
More posts by Michael Riordan.

No credit card required. Up and running in minutes.
More than 2,100 enterprises around the world rely on Sumo Logic to build, run, and secure their modern applications and cloud infrastructures.
