Get the report
MoreOctober 19, 2021
I have always found data collection to be a fascinating area of work at Sumo Logic. Collecting data is a critical first step for all the solutions we develop for our customers. After all, to observe the health and performance of your applications, you must first collect all relevant data. It's also an area that has seen some significant activities by the open-source community over the years, which is completely changing the landscape of observability as we know it. As a product manager, it's an inspiring space. As Sumo Logic's Open Source Ambassador, it's been incredible to see the change that open-source has driven in data collection and observability.
In today's digital transformation journey, observability has emerged as the hot topic. The ability to capture, analyze and correlate all of your machine data is critical to ensure you can meet your reliability objectives. Every level of the application stack emits logs, metrics, traces, and events. The collection of all of these signals is the first step of having an observable system.
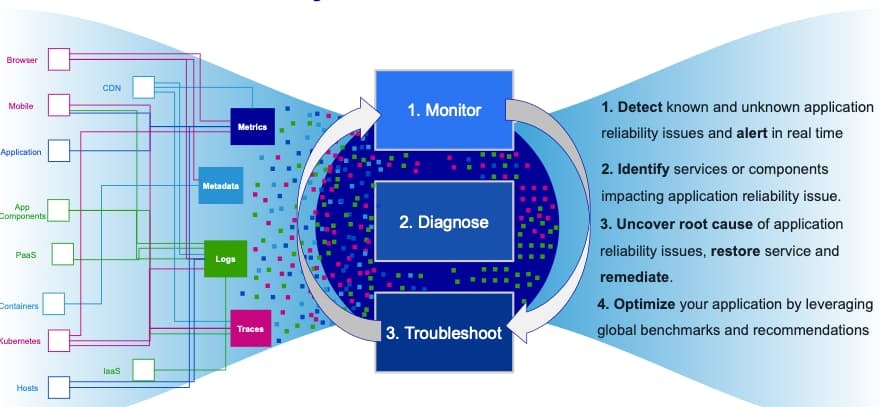
For many years, vendors provided proprietary agents to collect all of this data. Many of you probably had, perhaps even still have, multiple vendor agents running in your infrastructure, each gathering, enriching, and shipping data off to numerous vendors. All vendors in this space started this way, and for many years, it was the standard of data collection.
Next came the emergence of open-source agents to collect data. With the backing of a large vibrant community, these agents quickly grew in the breadth of integrations and the features they offered. Leveraging open-source agents for data collection gives you the freedom of choice. You could choose which technologies you want to standardize for data collection and leverage that stack to send data to the vendors you choose. Over time every vendor supported these agents.
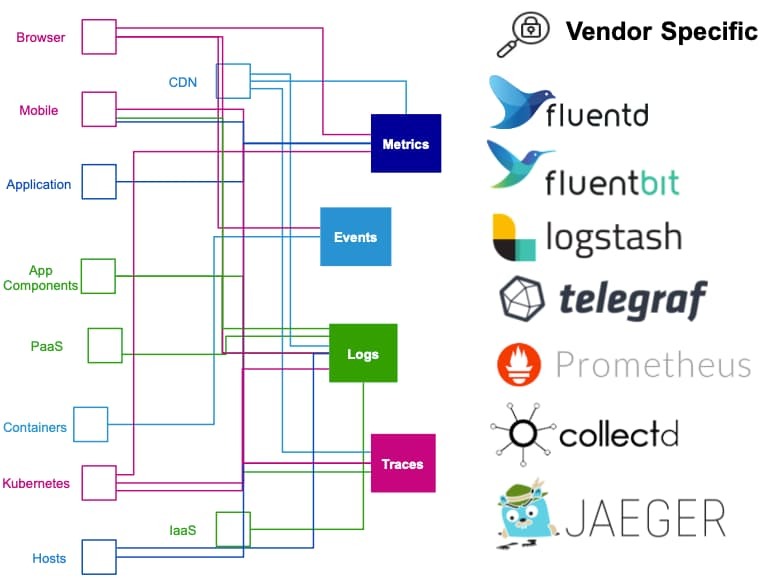
While this shift to open source agents and standards brought many benefits, it also brought a few challenges. There was not a single framework or standard for all the critical signals for observability. As a result, you ended up having to adopt multiple tools; Fluentd or Fluent Bit for logging, Prometheus or Telegraf for metrics, Zipkin or Jaeger for distributed tracing. This fragmentation created a lot of friction when adopting open-source data collection. However, once again, we see a shift in data collection.
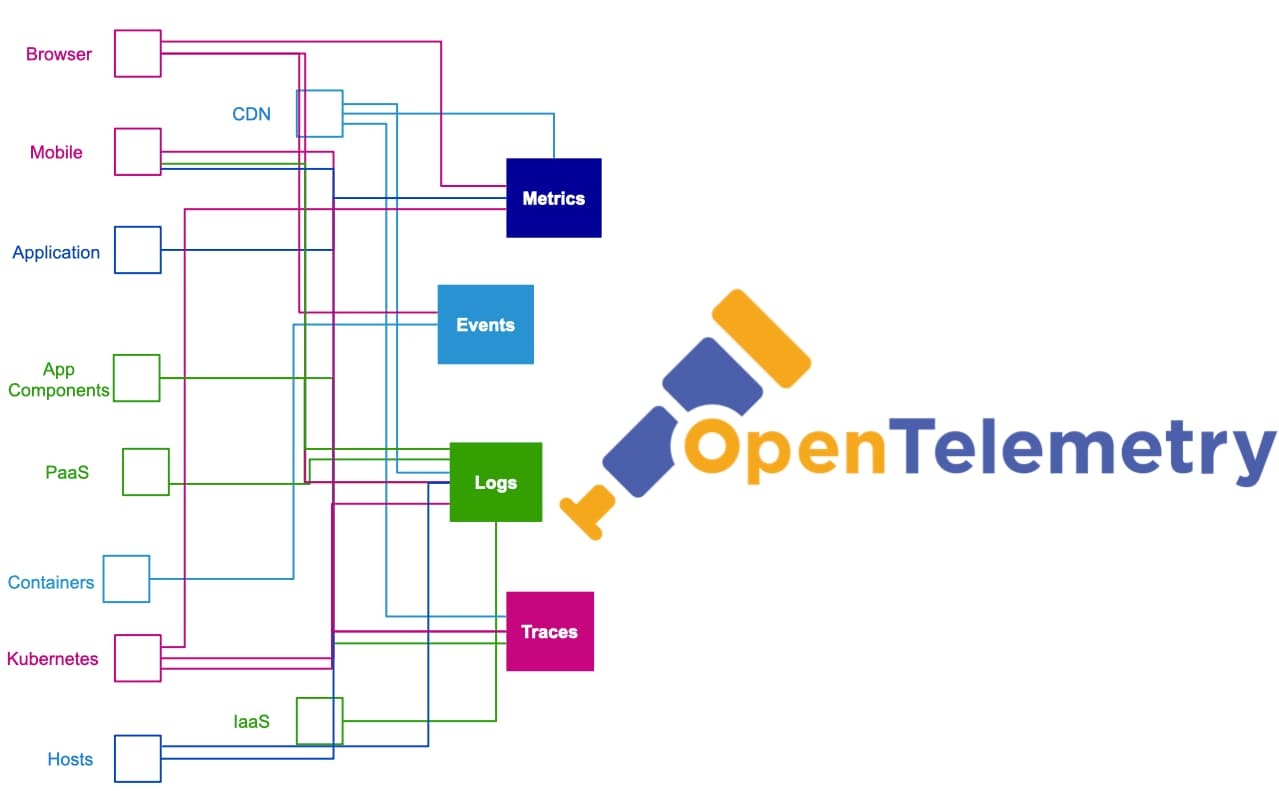
OpenTelemetry is becoming the gold standard to collect all of your machine data and is changing observability as we know it. Instead of learning multiple technologies to collect all data, you can leverage a single cloud-native framework to complete your observability.
OpenTelemety is a CNCF incubating project with quite a history. It was born out of two other projects, OpenTracing and OpenCensus, both of which were working towards the common goal of developing an industry wide standard for software instrumentation. Both projects were solving the same problems and this led users to have to choose which to standardize on. The simple problem here was a competing standards problem I am sure you are very familiar with. To reconcile this conflict, in 2019 both projects merged to become OpenTelemetry.

OpenTelemetry is a collection of tools, APIs, and SDKs that you can use to instrument, generate, collect, and export all machine data. OpenTelemetry gives you visibility into every layer of the stack and consists of three primary components.
The specification defines the cross-language requirements for all implementations. It consists of an API to generate your observability data, an SDK that provides the implementation of the API and the ability to export the data, as well the semantic conventions and protocol of OpenTelemetry.
The collector is a vendor-neutral way to receive, process, transform, and export data. It is a single agent for all observability data, including logs, metrics, and traces. It removes the need to run multiple agents to support data collection leveraging open standards. The collector is also architected to make it easy to extend and create additional distributions of the collector as needed. OpenTelemetry users and vendors can build optimized versions of the collector while still leveraging all the great standard features they need.
Instrumentation libraries let you integrate your applications with OpenTelemetry. They provide support for multiple frameworks and languages today, with more being added all the time. In addition to supporting manual instrumentation, many also offer auto-instrumentation. Metrics and traces are supported for instrumentation today, with logs support coming.
The three key components identified above provide you with a robust framework to step up your observability game and disrupt observability as we know it. By providing a comprehensive framework to collect logs, metrics, and traces, OpenTelemetry ensures you have visibility into every level of the stack. From the infrastructure to the application to your end-users, OpenTelemetry gives you comprehensive visibility into the health and performance of every layer.
Portable - OpenTelemetry provides data collection built on open standards, giving you a choice! You no longer have to leverage proprietary agents or a complicated set of multiple tools to achieve observability.
Control - You are in charge of your data and have complete control over it. OpenTelemetry lets you build robust pipelines to have complete control over the data collected, any transformations to it, and where it should be delivered. OpenTelemetry contains a rich set of capabilities to ingest, transform and ship data.
Supported - OpenTelemetry is supported by every major cloud provider and vendor in the observability space who actively contributes to the project. As consumers of open-source software, we recognize the importance of giving back to the community. Sumo Logic is an active contributor in many areas of the OpenTelemetry project. We are engaged in the Logging SIG and actively contributing to multiple projects in OpenTelemetry, including the OpenTelemetry Collector.
In case it is not clear by now, we at Sumo Logic believe OpenTelemetry to be the future of observability and data collection more broadly. It provides customers with a single agent for all logs, metrics, and traces collection supported in multiple environments, whether a machine in your data center, a fleet of compute instances in your public cloud provider, or your Kubernetes environment. Our distribution is built entirely on upstream OpenTelemetry Collector while adding some features and capabilities to improve your experience when using Sumo Logic. Configuring our distro is the same as any other OpenTelemetry collector. Let’s take a deeper dive into OpenTelemetry configuration.
Extensions are used primarily for tasks that do not require access to the data pipeline. Here we have configured the Sumo Logic extension with our API access ID and access key. This ensures that the collector can register with the Sumo Logic backend to send health and heartbeat information.
extensions:
sumologic:
access_id: ${ACCESS_ID}
access_key: ${ACCESS_KEY}
Receivers are how we get data into the collector. Our distro supports many different receivers for all your needs. Perhaps you need to read some data from a log file or need to collect Syslog data.
receivers:
filelog/myapp-other-app:
include: [/myapp-other-app/*.log]
start_at: beginning
syslog/myapp:
udp:
listen_address: "0.0.0.0:5514"
protocol: rfc3164
Maybe you have some apps already instrumented with Statsd compatible libraries.
statsd:
endpoint: "localhost:8127"
Or perhaps you have already instrumented with OpenTelemetry libraries and just need to leverage the OTLP receiver.
otlp:
protocols:
grpc:
http:
One receiver unique to our distro is our Telegraf receiver. We have supported Telegraf as an agent for metrics collection for some time. With the support of over 200 integrations to collect metrics from many different technologies, Telegraf is a powerful agent for metrics collection. While OpenTelemetry metrics receivers are growing all the time, we wanted to make sure that our customers could take advantage of all of those integrations without having to run multiple agents. With the Telegraf receiver, you can drop your existing Telegraf configuration into our distro for easy and seamless collection of the same data.
telegraf:
separate_field: false
agent_config: |
[agent]
interval = "30s"
flush_interval = "30s"
[[inputs.mem]]
[[inputs.disk]]
[[inputs.ecs]]
OpenTelemetry and our distro support many different receivers to collect all of your data.
Processors let you transform your data. Perhaps you want to add some metadata to your data streams for better correlation or leverage sampling on tracing.
processors:
resource/common:
attributes:
- key: env
value: prod
action: insert
Exporters are how we get data out of the collector. In this case, we can simply enable the Sumo Logic exporter to get all the above data flowing into Sumo Logic.
exporters:
sumologic:
Our exporter is also available in upstream OpenTelemetry. This ensures that if you are already using OpenTelemetry, you can still send your data to Sumo Logic.
Last but not least are services. In order to be leveraged, the receivers, processors, and extensions you define above must be here to be activated and used. Services are pretty powerful and let you define pipelines for processing your data. You can control the processing and routing performed on each data stream, which gives you complete control over your data. You can build multiple pipelines for each type of data and control what receivers, processors, and exporters are used within each pipeline.
service:
extensions: [sumologic]
pipelines:
logs/app:
receivers: [syslog/myapp]
processors: [batch,resource/common,resource/myapp-logs]
exporters: [sumologic]
logs/host:
receivers: [filelog/host-logs]
processors: [batch,resource/common,resource/host-logs]
We are excited for the future of data collection and OpenTelemetry and cannot wait for you to experience Sumo Logic with our distribution of OpenTelemetry. This is only the beginning of our journey with OpenTelemetry. Be sure to watch the demo to see Sumo Logic Distribution of OpenTelemetry in action.
Reduce downtime and move from reactive to proactive monitoring.
Build, run, and secure modern applications and cloud infrastructures.
Start free trial