
2022 Gartner® Magic Quadrant™ SIEM
Get the report
MoreTrusted by thousands of customers globally.
Browse our library of ebooks, briefs, reports, case studies, webinars & more.
September 10, 2020
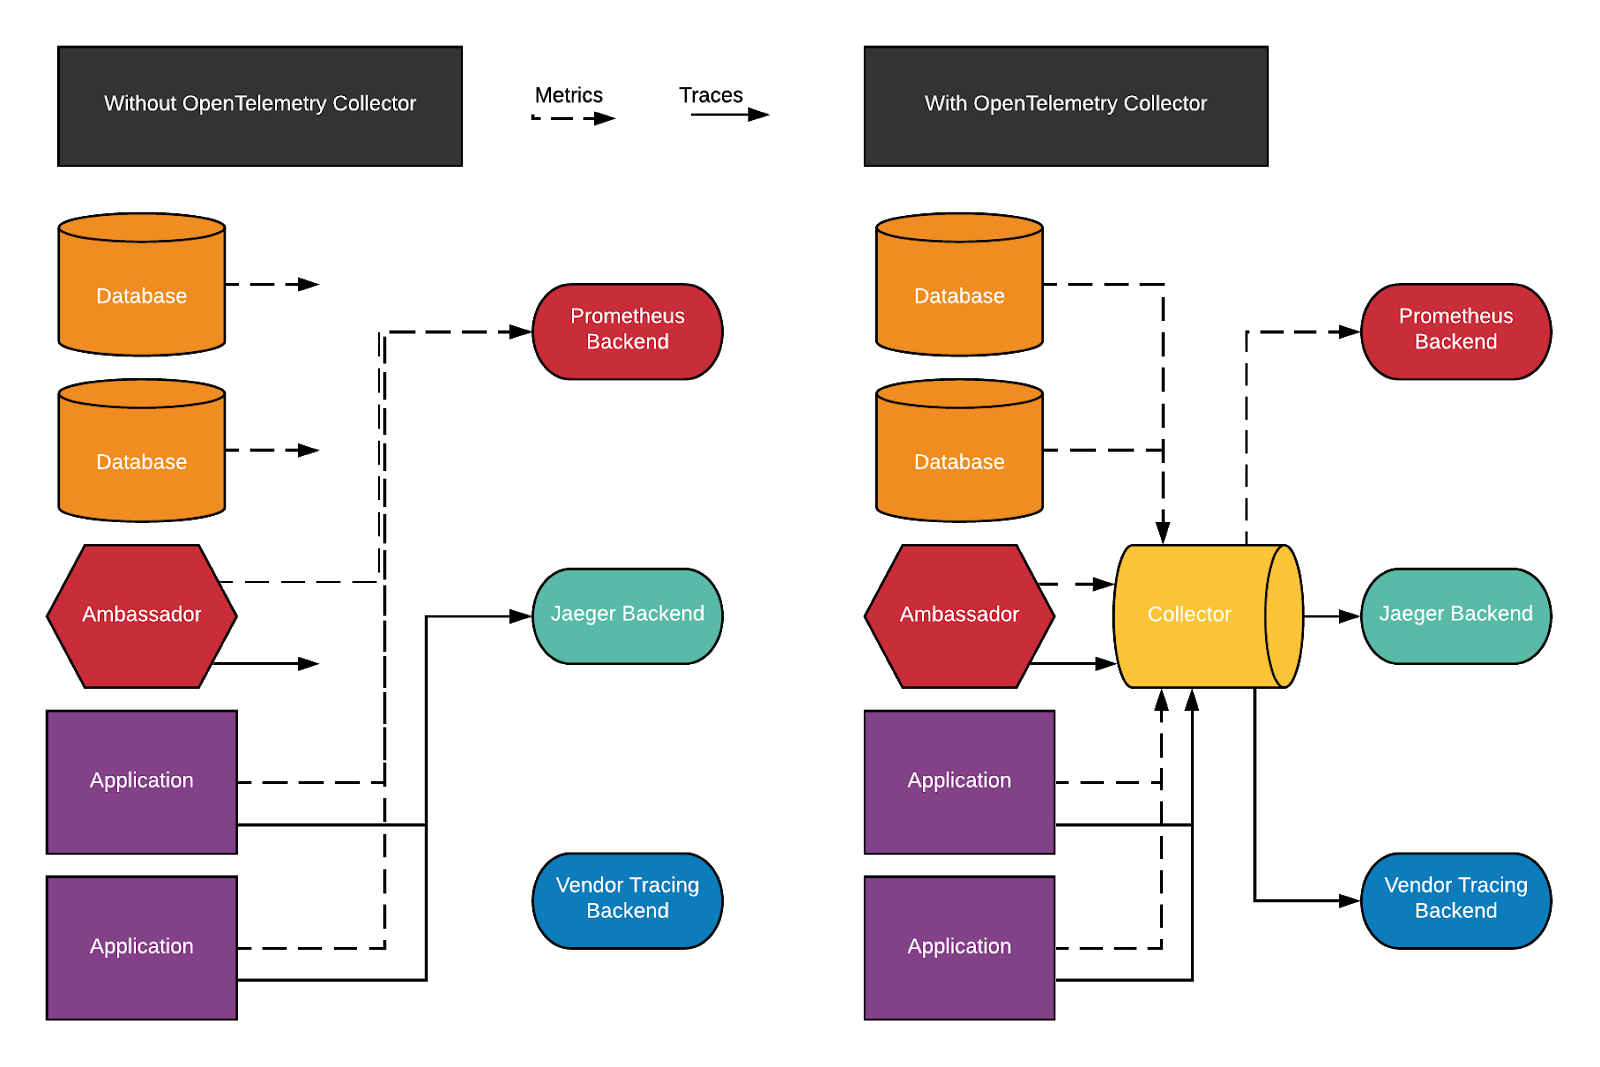
The OpenTelemetry Collector is a new, vendor-agnostic agent that can receive and send metrics and traces of many formats. It is a powerful tool in a cloud-native observability stack, especially when you have apps using multiple distributed tracing formats, like Zipkin and Jaeger; or, you want to send data to multiple backends like an in-house solution and a vendor. This article will walk you through configuring and deploying the OpenTelemetry Collector for such scenarios.
Over the last few years, there has been a proliferation of observability standards in the cloud-native space. On the tracing side there’s been Jaeger and Zipkin competing for mindshare, and the OpenTelemetry project that attempted to unify those standards. On the metrics side there are Prometheus, Graphite, StatsD, and more. In many organizations many of these tools are deployed in multiple applications. Or, there might be a third-party tool that uses a different standard than the engineering org has decided on. These scenarios create a nightmare for observing a whole system.
The OpenTelemetry project is building tools to wrangle all these different observability producers and receivers, and make them usable for organizations. The Collector tool specifically acts as a universal middleware application for receiving traces and metrics data of various standards, and forwarding them to various backends in the correct standard that backend expects.
At my company, we use the OpenTelemetry Collector to both centralize and distribute traces and metrics for several reasons.
Without the OpenTelemetry Collector, several things are orphaned, namely:
The easiest way to get started with the collector is to get the example deployment file from Github. It will create a Deployment for the Collector, and a DaemonSet of agents that will forward to the collector from kubernetes node, along with ConfigMaps for both to provide configuration. With the Kubernetes CLI installed and your cluster setup (which will vary by provider), and the file downloaded, run:
$ kubectl apply -f k8s.yaml
However, almost every user will need to provide a custom configuration. We’ll focus on configuring the collector itself, rather than the Daemonset, which is an optional (but best practice) part of the architecture. The collector is robust and we have experienced no issues with sending data from apps directly to the collector in a production setting.
Configuring the Collector for your needs can be tricky the first time, but once you are familiar with the settings, it gets easier. There are five things you need to configure:
Let’s look at a config for the example presented above:
apiVersion: v1
kind: ConfigMap
metadata:
 name: otel-collector-configmap
 Namespace: otel
 labels:
   app: opentelemetry
   component: otel-collector-conf
Data:
 otel-collector-config.yaml: |
We have three receivers:
receivers:
     jaeger:
       protocols:
         grpc:
           endpoint: 0.0.0.0:14250
         thrift_compact:
           endpoint: 0.0.0.0:6831
         thrift_http:
           endpoint: 0.0.0.0:14268
     zipkin:
       endpoint: 0.0.0.0:9411
     prometheus:
      config:
        scrape_configs:
          - job_name: 'databases'
            scrape_interval: 5s
            static_configs:
              - targets:
                  - database1dns:9091
                  - database2dns:9091
That’s a lot, so let’s break it down by section.
There are five processors:
processors:
     memory_limiter:
       ballast_size_mib: 683
       check_interval: 5s
       limit_mib: 1336
       spike_limit_mib: 341
     queued_retry:
       num_workers: 16
       queue_size: 10000
       retry_on_failure: true
     batch:
       send_batch_size: 1024
       timeout: 5s
     probabilistic_sampler:
       hash_seed: 22
       sampling_percentage: 1
     k8s_tagger:
       passthrough: true
We’ve activated two extensions:
extensions:
     health_check: {}
     zpages: {}
We’ve created four exporters:
exporters:
     jaeger/1:
       endpoint: vendor-otelcol.vendor:14250
     jaeger/2:
       endpoint: "jaeger-collector.jaeger:14250"
     logging:
       loglevel: info
     prometheus:
       endpoint: "prometheus:9090"
       namespace: prometheus-operator
Here is where the magic happens, and the flexibility of the collector shines. We have three export pipelines, one for sending traces to the vendor, one for sending them to our in-house Jaeger, and one for sending metrics to our in-house Prometheus. Note that in these pipelines the order of the processors does matter.
service:
     extensions:
       - health_check
       - zpages
     pipelines:
       traces/1:
         receivers:
           - jaeger
           - zipkin
         processors:
           - memory_limiter
           - k8s_tagger
           - logging
           - batch
           - queued_retry
         exporters:
           - jaeger/1
       traces/2:
         receivers:
           - jaeger
           - zipkin
         processors:
           - memory_limiter
           - probabilistic_sampler
           - k8s_tagger
           - batch
           - queued_retry
         exporters:
           - jaeger/2
       metrics/1:
         receivers:
           - prometheus
         processors:
           - memory_limiter
           - batch
           - queued_retry
         exporters:
           - prometheus
The possibilities of the OpenTelemetry architecture in an observability pipeline are nearly endless. The configuration above is centralized, but the collector itself is lightweight. Teams could deploy their own collectors to avoid having to manage many hands working on one configuration.
The collector could be run as a sidecar to an application or a database as easily as run as a standalone service like configured above. In that case, all the collectors would be configured to send their metrics or traces to a central Prometheus or Zipkin/Jaeger, or split to a team’s Prometheus and a central one, etc.
The OpenTelemetry project is also currently exploring adding logging to its domain, meaning soon creating flexible, extensible pipelines for the entirety of the logs/metrics/traces observability trio could be this easy.
Reduce downtime and move from reactive to proactive monitoring.
Build, run, and secure modern applications and cloud infrastructures.
Start free trial
DevOps Engineer
Dave Sudia is an educator - turned developer - turned DevOps Engineer. He's passionate about supporting other developers in doing their best work by making sure they have the right tools and environments. In his day-to-day he's responsible for managing Kubernetes clusters, deploying databases, writing utility apps, and generally being a Swiss-Army knife. He can be found on Twitter @thedevelopnik
More posts by Dave Sudia.

No credit card required. Up and running in minutes.
More than 2,100 enterprises around the world rely on Sumo Logic to build, run, and secure their modern applications and cloud infrastructures.
