Get the report
MoreMarch 16, 2021
Cloud-native and serverless come hand in hand. One of the initial motivations to move business workflows to the cloud was related to cutting costs related to provisioning infrastructure and elasticity that on-demand allocation of resources is offering. The serverless approach takes this to the next level, where infrastructure is provisioned only for the time of code execution, and the whole stack below the executed code, including application components, OS, and hardware (of course) is provided by the cloud vendor. No surprise this approach takes more and more traction, although it’s nothing new.
This elasticity though has its downsides, lack of control and visibility into the underlying infrastructure stack makes observability of such an environment equally challenging as important. Logs and metrics are a good starting point and Sumo Logic has provided them for some time. However more and more customers require more than that, especially if serverless functions like AWS Lambdas for example are just part of larger, complex distributed applications. Then, visibility into end-to-end transaction execution, dependencies, errors, and latency propagations is key to quick troubleshooting and mean time to repair that is a key contributor to high application reliability, healthy business, and happy customers.
Sumo Logic provides such a solution with its APM/tracing powered by OpenTelemetry and we were very happy to hear that AWS also sees this as a future of observability. We are happy to announce that we have tested, qualified, and certified AWS OT distro Lambda components as fully compatible and ready to use with Sumo Logic which means that immediately all Sumo Logic customers get expanded tracing visibility into their Lambda functions, regardless of the language used: Java, JS, Go, Python are all supported. These instrumentations are easy to install, with little or no code changes required, and collect data in the Lambda Layer (where available) ensuring low footprint and reliability of data transfer.
Sumo Logic Observability platform through its intuitive workflows, integrates all observability signals, including tracing and now with Lambda covered and existing great AWS Observability infrastructure monitoring provides comprehensive observability offering for AWS serverless workloads.
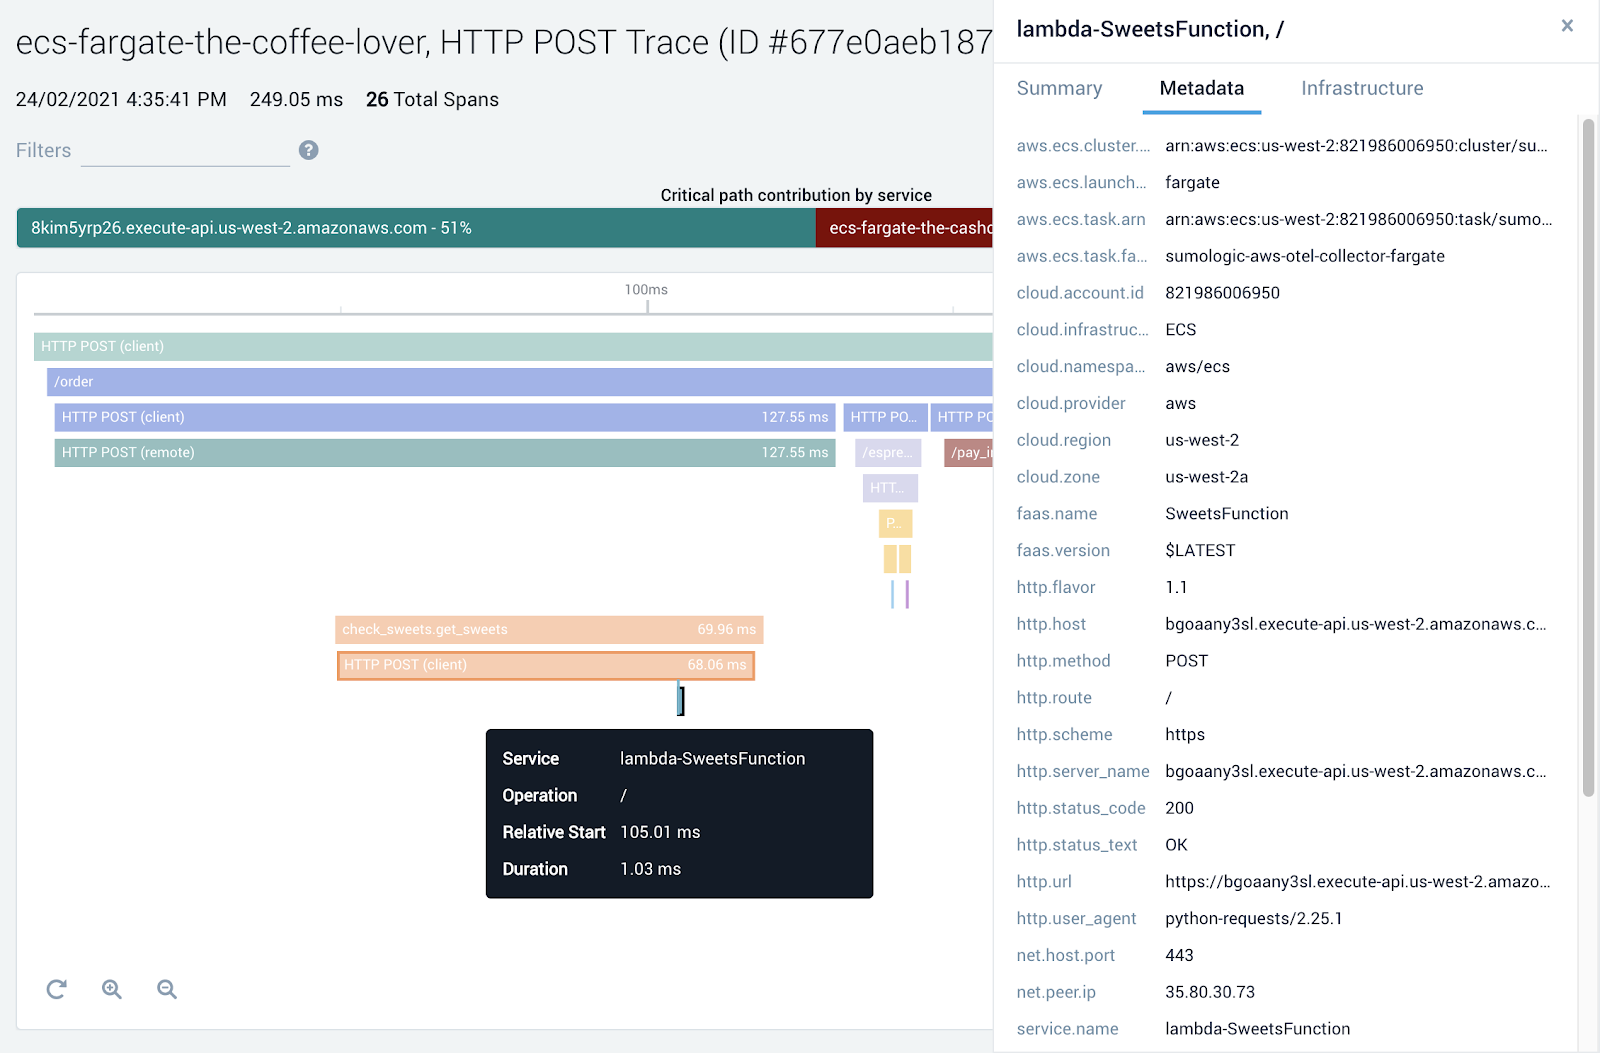
After deploying AWS Lambda instrumentation for Java, JS, Go, or Python and connecting the collector to Sumo Logic endpoint, you can enjoy end to end visibility of your transactions including Lambda calls (here in orange) in both purely serverless or mixed environments:

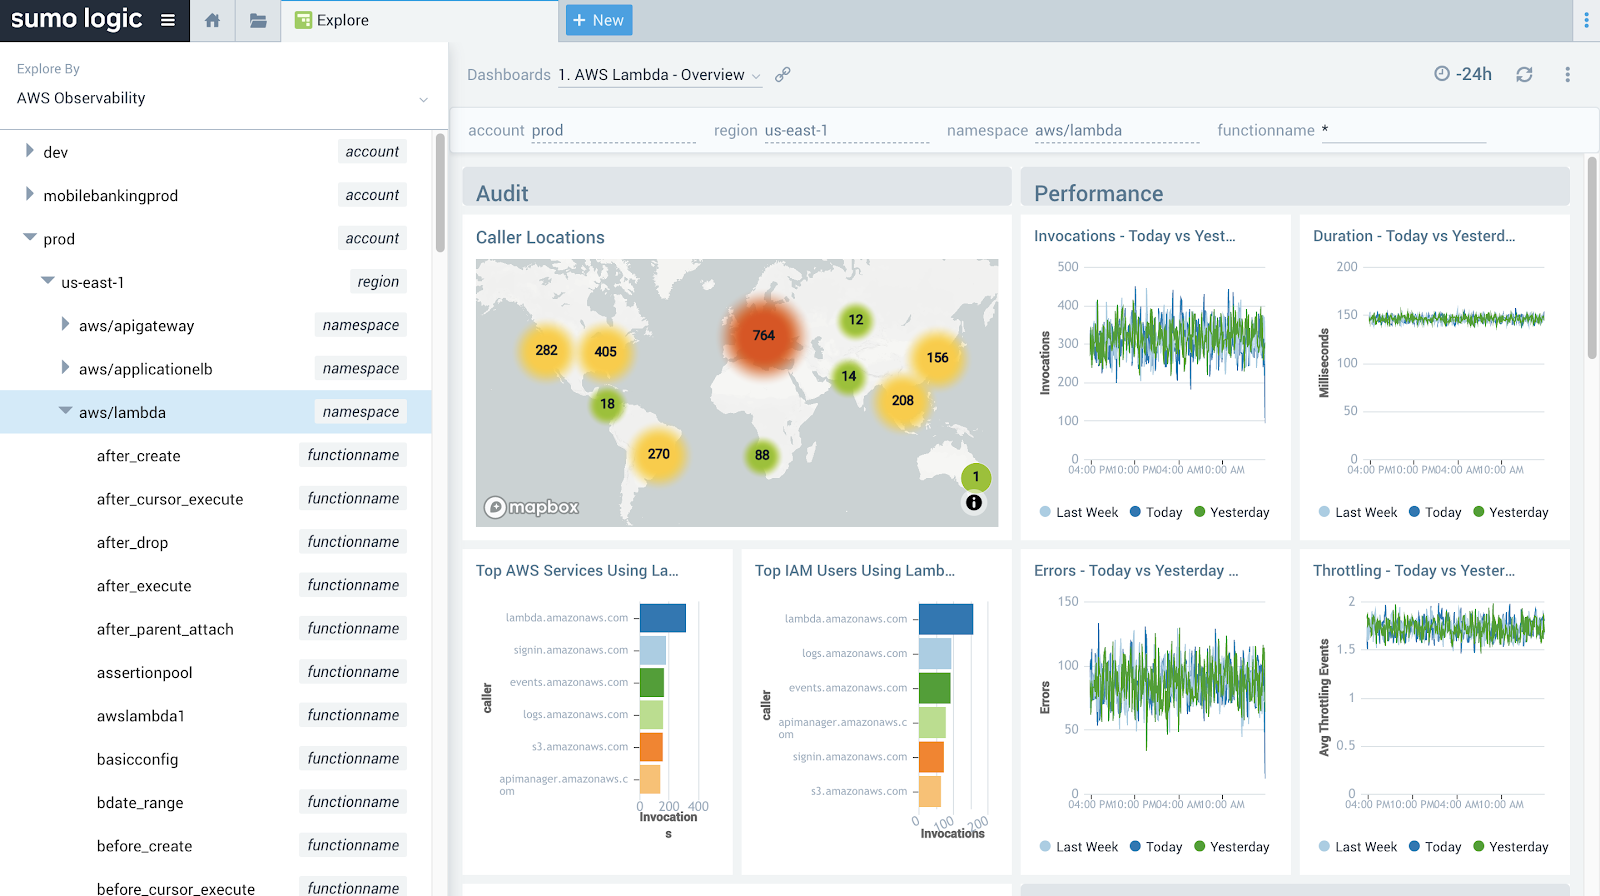
If you are interested in more high-level details about the execution of your Lambda functions, in the same UI you can quickly jump to high-level AWS Lambda dashboards providing you the full breadth of information about the health and performance of your serverless environment:

Similarly, if you spot any latency spikes and errors on the dashboard above, you can use our entity-based navigation to search for traces from this very moment.
Sumo Logic provides top-down visibility into your serverless workflows, with open source, industry standard collection mechanisms through AWS monitoring and OpenTelemetry, without any vendor lock-in or proprietary code. You can get full details of your code execution in lambda, inspect the responses and timings of the lifespan of the function and monitor high-level KPIs of health, performance, and availability of your Lambda environment. Let us know what you think or learn more in #sumo-tracing on Sumo Dojo slack channel or (if you’re not yet a customer) - contact us using the chat button in the bottom-right corner of your browser.
Reduce downtime and move from reactive to proactive monitoring.
Build, run, and secure modern applications and cloud infrastructures.
Start free trial