Get the report
MoreSeptember 17, 2019
Kubernetes is great but complex!
Whether to enable hybrid and multi-cloud, promote deeper specialization among development teams, enhance reliability, or simply stay ahead of the curve, organizations are reaping the varied benefits of this technology investment— but it comes at a cost. With each optimization, there are tradeoffs. With each layer of abstraction comes less visibility, resulting in more complexity when something goes wrong. As organizations race to adopt Kubernetes, unique challenges emerge that stretch the limits of existing monitoring solutions.
Learn how to monitor, troubleshoot, and secure your Kubernetes environment with Sumo Logic.
There are many more things to monitor
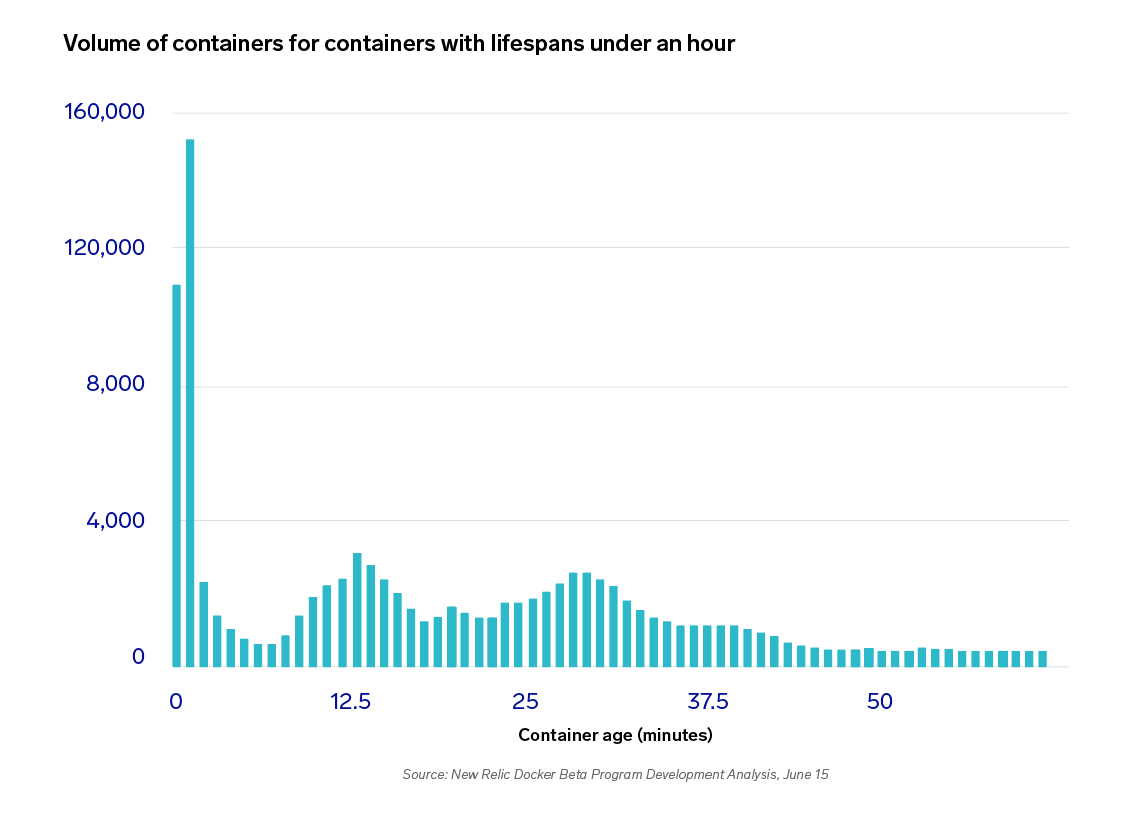
Instead of monitoring a static set of physical or virtual machines, containers are orders of magnitude more numerous with much shorter lifespans. Thousands of containers now live for mere minutes while serving millions of users across hundreds of services. In addition to the containers themselves, administrators must also monitor the Kubernetes system and its many components, ensuring they are all operating as expected. When trying to display the sheer volume of information pouring out of a containerized environment, most tools come up short.

Everything is ephemeral
Everything in Kubernetes is, by design, ephemeral. Kubernetes achieves its elastic ability to scale and contract by taking control over how pods—and the containers within those pods—are deployed. A job needs to be done and Kubernetes schedules a pod. When the job is complete, the pod is destroyed just as freely. But zoom out and we notice that Kubernetes has made the nodes replaceable as well. A server dies and pods are rescheduled to available nodes. Zoom out yet again to the clusters and these too are just as easily replaced.
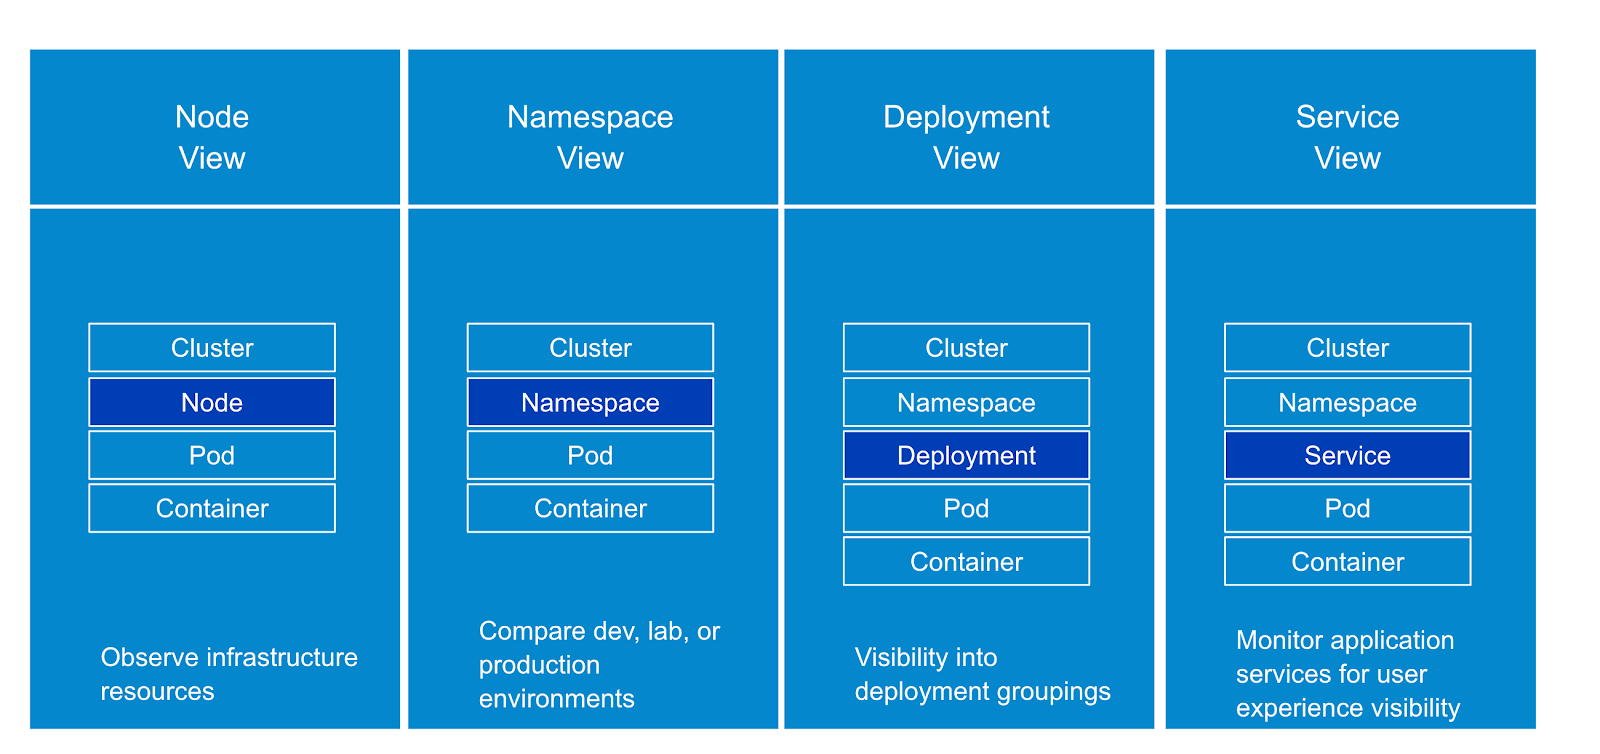
You have to zoom all the way out to the services to find a component with any staying power inside of Kubernetes. Services and deployments represent the core application. They still change but much less than their underlying components. Most tools weren’t designed to look at an environment from the perspective of these logical abstractions. But these logical abstractions are how Kubernetes organizes itself. Kubernetes has different hierarchies — services, namespace, deployment, or node centric views. Tools should have the flexibility to view Kubernetes through these various lenses.

Tools are distributed
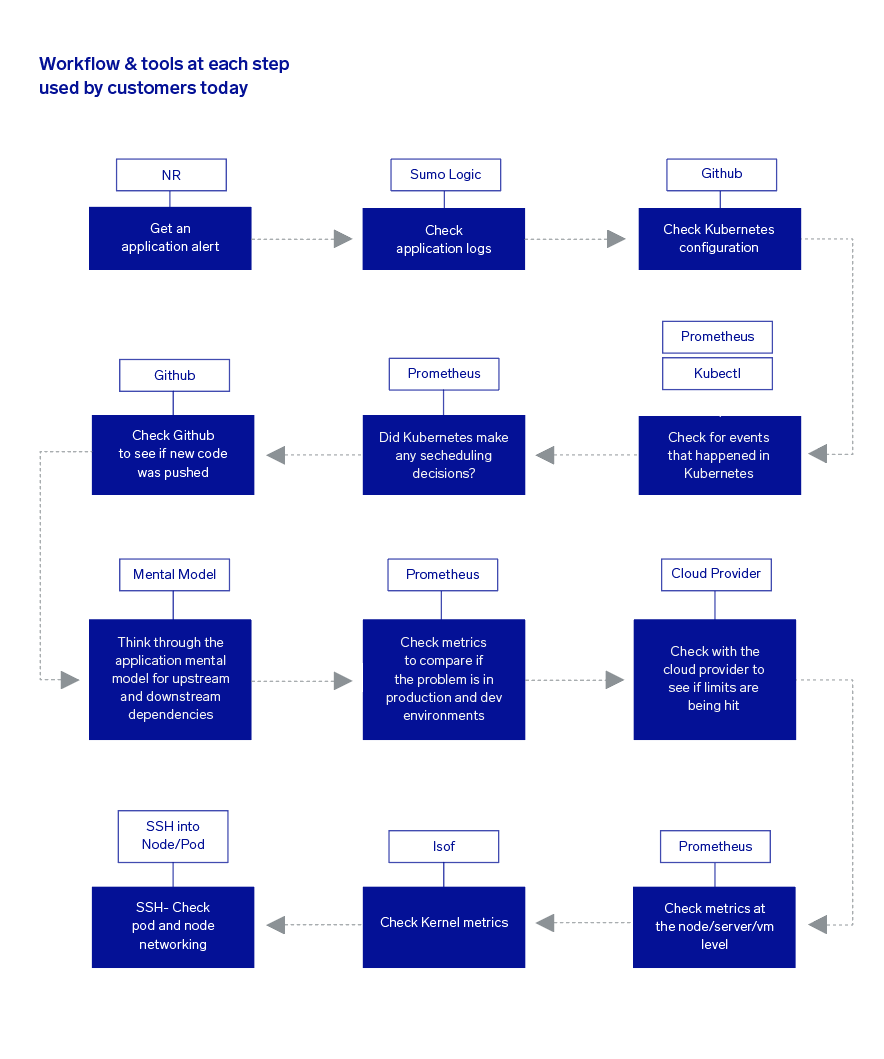
Between logging tools, metrics tools, GitHub, and even SSH, engineers are constantly switching between a variety of tools to gain a complete picture of their system, i.e., observability. Walking through a typical alert investigation, we can quickly get a sense of this. An alert comes in and we immediately go check the logs to find out more about the specific problem. Running through a mental checklist of potential problems, we log into GitHub to see if any new code has been pushed. Did Kubernetes make any scheduling decisions? What are the upstream and downstream dependencies of the error I am seeing? And so on. Rarely are the answers to the puzzle nicely connected and in one place. But the more they are, the quicker we can resolve the issue.

Additional Resources
Monitor, troubleshoot and secure your Kubernetes clusters with Sumo Logic cloud-native SaaS analytics solution for K8s.
Learn more