Get the report
MoreAugust 21, 2019
If you are reading this article, you’re probably familiar with syslog, a logging tool that has been around since the 1980s. It is a daemon present in most Linux-based operating systems.
By default, syslog (and variants like rsyslog) on Linux systems can be used to forward logs to central syslog servers or monitoring platforms where further analysis can be conducted. That’s useful, but to make the very most of syslog, you also want to be able to analyze log data.
Toward that end, this article outlines the process of taking local system logs and forwarding these into Sumo Logic using the Sumo Logic Collector.
We’ll also demonstrate how to send logs from our server(s) using the syslog or rsyslog daemons on the server.
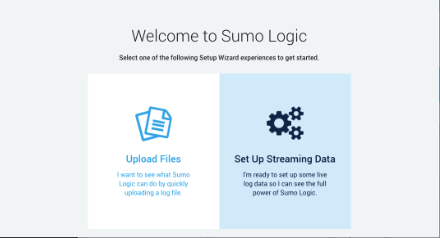
In order to be able to stream logs into Sumo Logic, we need to sign up for a package first. There are paid options, but if you’re wanting to test out Sumo Logic and have a fairly low volume of logs to stream, then there is a free option available which allows you to ship up to 500MB/day! Once you’ve signed up, you should see a page similar to the following which gives you the option to upload a log file to see how Sumo Logic will display it, or you can immediately jump to streaming logs from your server or servers. We’re going to opt for the latter option!

You’ll note that once you’ve clicked the Set Up Streaming Data button, you are presented with a number of different options allowing you to quickly get started on AWS environments through to Linux systems, Windows systems and even Apple Mac systems!
In this article, we’re going to choose the Linux System option which will allow us to deploy the Sumo Logic collector with one simple command similar to the following:
sudo wget "https://collectors.de.sumologic.com/rest/download/linux/64" -O SumoCollector.sh && sudo chmod +x SumoCollector.sh && sudo ./SumoCollector.sh -q -Vsumo.token_and_url=<unique_token>
Once you have executed the command on your system, the collector should install and automatically register into Sumo Logic, at which point it’ll allow you to click Continue.
Next, you’ll be able to configure the source information for your data. We’ll start by setting the source category, which is a metadata tag added to each metrics time series at collection time. You can set any name that you wish, and this can be used to help you locate metrics coming from this source in the future.
At this point in the process, you can also configure which log files you want to collect log data from. By default you’ll note that /var/log/secure* and /var/log/messages* are selected for scraping. You can of course add any other log files you wish to collect. A good example might be the log file your app populates when running.
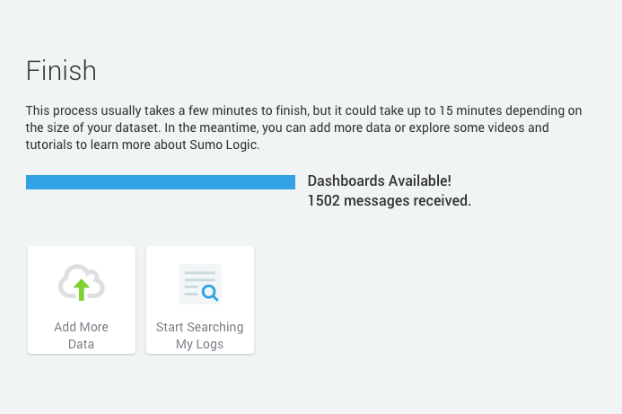
Finally, you can elect to use the time zone present in your log file or ignore it and utilize a different time zone. Now you should be ready to click Continue! At this point, dependant on the size of your logs, you might want to go make a coffee while the Collector configuration finalizes and adds your data.
Once complete, you should see something similar to the following:

Now, let’s move on to the fun part: viewing our logs and searching them for information! You can immediately view the logs streamed from your server by using the example search option at the top of the page named “Linux System.” I amended the search query to also include logs with the name “sumologic” in them.
This is what my results look like!
As you can see above, we see the source host, the name of the log file the data came from and the category of “linux/system” which is what we set earlier during the setup!
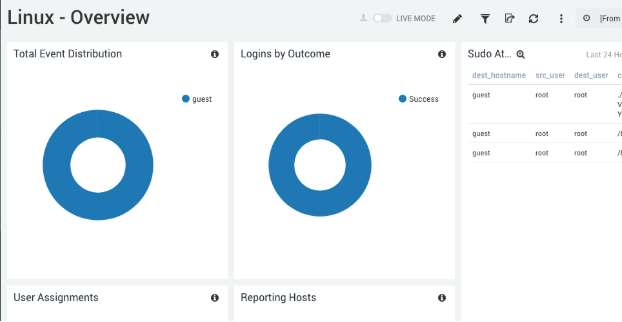
There is also a handy dashboard out of the box which allows you to see some common information when you log in. You can of course modify this and add new graphs based off of the information in your logs. This can be used for a number of different functions such as detailing HTTP errors in your application—or if monitoring something like a mail server, detailing the amount of emails being bounced or rejected.

In order to do this, we need to start by configuring a new source in the Sumo Logic control panel. We can do this by navigating to Manage Data > Collection > Collection. Then we can click Add > Add Source > Syslog. Here we need to provide a name for our syslog source along with the protocol (TCP or UDP) and port number. For the purposes of this article, I selected UDP with port 1514. I opted to use the source category of linux/syslog. Now we can click Save. At this point, we should see a new service listening on UDP port 1514 on our server with the collector installed.
At this point we’re ready to configure syslog to send logs to our new syslog listener on the Collector. We can do this by editing the config file for syslog or rsyslog. In our case it’s the latter, which is located at /etc/rsyslog.conf. You’ll note at the bottom of this logfile that there is a line which is commented out.

We can uncomment this line and modify it to send all of the logs rsyslog maintains (designated by *.*) to our new listener, like so:

You’ll note that we’ve also chosen to use one @ symbol, which tells rsyslog to use UDP instead of TCP to send logs.
One final note about why you would want to take the approach described in this article in the first place.
You may wish to set up the collector on a central syslog server in your organization that then forwards all logs on to Sumo Logic. The advantage of this approach is that you don’t have to have the collector installed on all your servers individually, and thus you don’t need to have your corporate firewall opened to allow the traffic from so many sources.
Sumo Logic offers a comprehensive cloud solution which is open to allowing you to extend listeners into your own environment to workaround limitations sometimes present in larger organizations. This combined with the interface, the streamlined setup process and dashboards makes it a really competitive solution which will help you to spot issues and proactively monitor logs for issues before they even affect customers.
Reduce downtime and move from reactive to proactive monitoring.
Build, run, and secure modern applications and cloud infrastructures.
Start free trial