
This week, CEO Ramin Sayar offered insights into Sumo Logic’s Unified Logs and Metrics announcement, noting that Sumo Logic is now the first and foremost cloud-native, machine data analytics SaaS to handle log data and time-series metrics together. Beginning this week Sumo Logic is providing “early access” to customers that are using either Amazon CloudWatch or Graphite to gather metrics.
That’s good news for practitioners from developers to DevOps and release managers, because as Ben Newton explains in his blog post you’ll now be able to view both logs and metrics data together and in context. For example, when troubleshooting an application issue, developers can start with log data to narrow a problem to a specific instance, then overlay metrics to build screens that show both logs and metrics (like CPU utilization over time) in the context of the problem.
What Are you Measuring?
Sumo Logic already provides log analytics at three levels:
- System (or machine)
- Network
- Application
Unified Logs & Metrics also extends the reporting of time-series data to these three levels. So using Sumo Logic you’ll now be able to focus on application performance metrics, infrastructure metrics, custom metrics and log events.
Custom Application Metrics
Of the three, application metrics can be the most challenging because as your application changes, so do the metrics you need to see. Often you don’t know what you will be measuring until you encounter the problem. APM tools provide byte-code instrumentation where they load code into the JVM. That can be helpful, but results are restricted to what the APM tool is designed or configured to report on. Moreover, the cost for instrumenting code using APM tools can be expensive. So developers, who know their code better than any tool, often resort to creating their own custom metrics to get the information needed to track and troubleshoot specific application behavior.
That was the motivation behind an open-source tool called StatsD. StatsD allows you to create new metrics in Graphite just by sending it data for that metric. That means there’s no management overhead for engineers to start tracking something new: simply give StatsD a data point you want to track and Graphite will create the metric.
Graphite itself has become a foundational monitoring tool, and because many of our customers already use it Sumo Logic felt it important to support it. Graphite, which is written in Python and open-sourced under the Apache 2.0 license, collects, stores and displays time-series data in real time. Graphite is fairly complex, but the short story is that it’s good at graphing a lot of different things like dozens of performance metrics from thousands of servers.
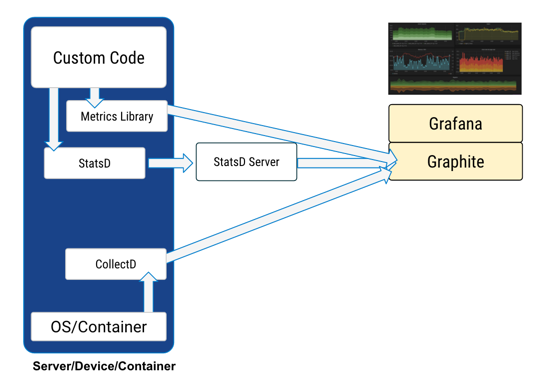
So typically you write an application that collects numeric time-series data and sends it to Graphite’s processing backend (Carbon), which stores the data in a Graphite database. The Carbon process listens for incoming data but does not send any response back to the client. Client applications typically publish metrics using plaintext, but can also use the pickle protocol, or Advanced Message Queueing Protocol (AMQP). The data can then be visualized through a web interface like Grafana.
But as previously mentioned, your custom application can simply send data points to a StatsD server. Under the hood StatsD is a simple NodeJS daemon that listens for messages on a UDP port, then parses the messages, extracts the metrics data, and periodically (every 10 seconds) flushes the data to graphite.
Sumo Logic’s Unified Logs and Metrics
Getting metrics into Sumo Logic is super easy. With StatsD and Graphite, you have two options. You can point your StatsD server to a Sumo Logic hosted collector or you can install native collector within the application environment.
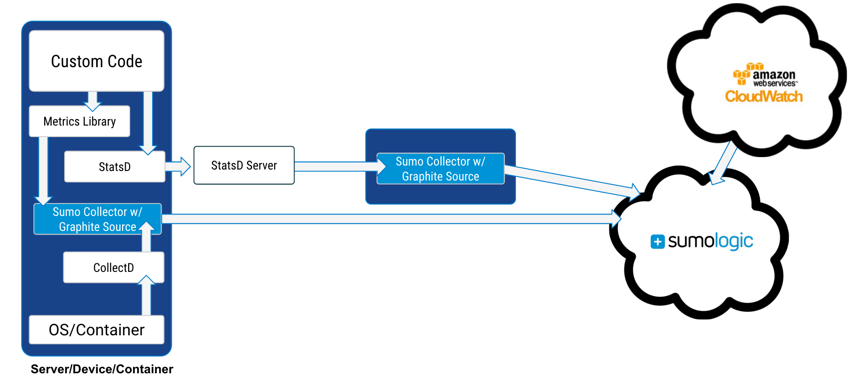
CloudWatch
CloudWatch is Amazon’s service for monitoring applications running on AWS and system resources. CloudWatch tracks metrics (data expressed over a period of time) and monitors log files for EC2 Instances and other AWS resources like EBS volumes, ELB, DynamoDB tables, and so on. For EC2 Instances, you can collect metrics on things like CPU Utilization, then apply dimensions to filter by instance ID, instance type, or image id. Pricing for AWS CloudWatch is based on Data Points. A DP = 5 minute of activity (specifically the previous minutes). A Detailed DP (DDP) = 1 minute.
Unified Logs and Metrics dashboards allow you to view metrics by category, and are grouped first by namespace, and then by the various dimension combinations within each namespace. One very cool feature is you can search for meta tags across EC2 instances. Sumo Logic makes the call once to retrieve meta tags and caches them. That means you no longer have to make an API call to retrieve each meta tag, which can result in cost savings since AWS charges per API call.
Use Cases
Monitoring – Now you’ll be able to focus on tracking KPI behavior over time with Dashboards and Alerts. Monitoring allows you to:
- Track SLA adherence
- Watch for anomalies
- Respond quickly to emerging issues
- Compare to past behavior
Troubleshooting – This about determining if there is an outage and then restoring service. With Unified Logs and Metrics you can:
- Identify what is failing
- Identify when it changed
- Quickly iterate on ideas
- “Swarm” issues
Root-cause Analysis – Focuses on determining why something happened and how to prevent it.Dashboards overlayed with log data and metrics allows you to:
- Perform historical analysis
- Correlate Behavior
- Uncover long term fixes
- Improve Monitoring
Correlating Logs and Metrics
When you start troubleshooting you really want to start correlating multiple types of metrics and multiple sources of log data. Ultimately, you’ll be able to start with Outliers and begin overlaying metrics and log data to quickly build views and help you quickly identify issues. Now you’ll be able to overlay log and metrics from two different systems and do it in real time.
If you want to see what Unified Logs and Metrics can do, Product Manager Ben Newton walks you through the steps of building on logs and overlaying metrics in this short introduction.

