Get the report
MoreJanuary 17, 2023

Kubernetes is first and foremost an orchestration engine that has well-defined interfaces that allow for a wide variety of plugins and integrations to make it the industry-leading platform in the battle to run the world's workloads. From machine learning to running the applications a restaurant needs, you can see that just about everything now uses Kubernetes infrastructure.
All these workloads, and the Kubernetes operator itself, produce output that is most often in the form of logs. Kubernetes infrastructure has very difficult to view - and in some cases collect - internal logs and the logs generated by all the individual workloads it is running. Most often, difficulty viewing Kubernetes metrics and logs is due to ephemeral containers.
This article will cover how Kubernetes monitoring is structured with logs, how to use its native functionality, and how to use a third-party logging engine to really enhance what can be done with logs generated from cloud-native environments. Lastly, this article will cover how to visualize deployment metrics in a Kubernetes dashboard designed to tell you everything that happens within a Docker container (with logs!).
Kubectl (pronounced "cube CTL", "kube control", "cube cuttle", ...) is a robust command line interface that runs commands against the Kubernetes cluster and controls the cluster manager. Since the command line interface (CLI) is essentially a wrapper around the Kubernetes API, you can do everything directly with the API instead of using the CLI, if it suits your purposes.
The most basic form of logging in Kubernetes is the output generated by individual containers using stdout and stderr. The output for the currently running container instance is available to be accessed via the kubectl logs command.
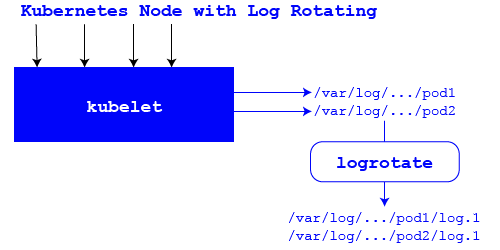
The next level up of logging in the Kubernetes node world is called "node level logging". This is broken down into two components: the actual log files being stored; and the Kubernetes side, which allows the logs to be viewed remotely and removed, under certain circumstances.
The actual files are created by the container runtime engine - like the Docker container - and contain the output from stdout and stderr. There are files for every running container on the host, and these are what Kubernetes reads when kubectl logs are run. Kubernetes is configured to know where to find these log files and how to read them through the appropriate log driver, which is specific to the container runtime.
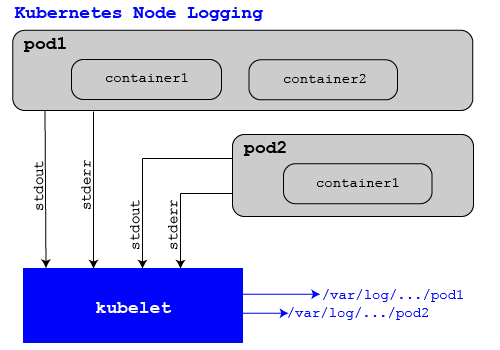
Kubernetes has some log rotating capabilities, but it is limited to when a pod is evicted or restarted. When a pod is evicted, all logs are removed by kubelet. When a pod is restarted, kubelet keeps the current logs and the most recent version of the logs from before the restart. Any older logs are removed. This is great but does not help keep the logs from long-running pods under control.
For any live environment with a constant stream of new log entries being generated, the reality of disk space not being infinite becomes very real the first time an application crashes due to no available space. To mitigate this, it is best practice to implement some kind of log rotation on each node that will take into account both the number of pods that potentially will be run on the node and the disk space that is available to support logging.
While Kubernetes itself can not handle scheduled log rotation, there are many tools available that can. One of the more popular tools is log rotate, and like most other tools in the space, it can rotate based on time (like once a day), the size of the file, or a combination of both. Using size as one of the parameters makes it possible to do capacity planning to ensure there is adequate disk space to handle all the number of pods that could potentially run any given node.
There are two types of system components within Kubernetes: those that run as part of the OS, and those that run as containers managed by kubelet. As kubelet and the container runtime run as part of the operating system, their logs are consumed using the standard OS logging frameworks. As most modern Linux operating systems use systemd, all the logs are available via journalctl. In non-systemd Linux distributions, these processes create ".log" files in the /var/logs/ directory.
The second type of system components that run as containers - like the schedule, API-manager, and cloud-controller-manager -- have their logs managed by the same mechanisms as any other container on any host in that Kubernetes cluster.
A Kubernetes monitoring challenge with cluster-level logging is that Kubernetes has no native cluster-level logging. The good news is that there are a few proven methods that can be applied cluster-wide to provide the same effective result of all the logs being collected in a standardized way and sent to a central location.
The most widely-used methods are:
Configure an agent on every Kubernetes node
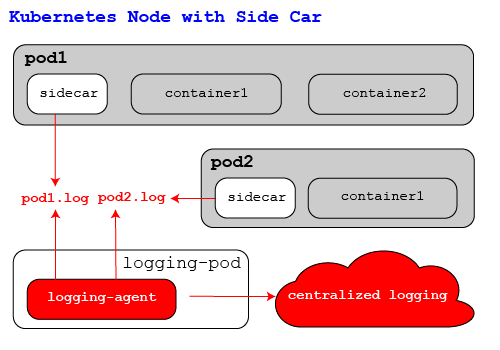
Include a sidecar that attaches to every Kubernetes pod
Configure every containerized application individually to ship its own logs
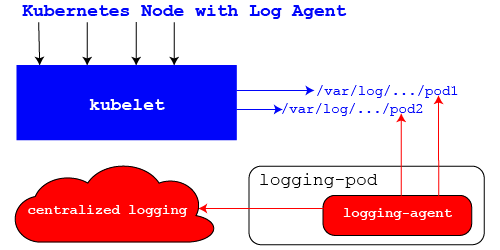
Installing a running agent on every node, preferably as a DaemonSet in Kubernetes, but it could be at the Operating System level.
The benefits are that it requires no changes to the Kubernetes cluster and can be extended to capture other system logs. But the downfall is that it requires a container to run with elevated privileges to access the files that some environments will not be friendly to.
This actually has two options for deployment; the first is the sidecar simply diverts all the log traffic to a custom stdout file that is watched by a custom node logging agent and then shipped off. Or, the sidecar can ship traffic directly to the central logging repository.
While this option requires no changes to the individual container images, it does require changes to the deployment specification for every application that is deployed. This is a great option if you can not run containers with elevated privileges, or only want to send different applications to different logs repositories. But that flexibility comes with more moving parts to configure than the node-agent option that needs to be watched.
Configuring the applications directly has the same benefits as the sidecar option listed above, and can potentially provide even more valuable information as the application development team can tailor what messages are being generated. The biggest downfall revolves around the fact it is upstream in the application lifecycle and, therefore, needs involvement from the development teams to ensure it is implemented. This leads to additional cross-team coordination and can increase timelines when changes are required, due to the nature of a larger group being involved in all related activities.
Viewing logs with Kubernetes native tools is completely centered around the kubectl command line utility. The most useful piece of documentation around kubectl is the cheat sheet that is part of the official documentation, as it tracks all the options and parameters that are available through the command.
First is the most basic commands that will get used to view the logs from a known container. You can view individual log streams (stdout or stderr, for example), but most people just view all the logs for more context.
If you wish to follow the live stream of log entries (i.e., tail -f in Linux/UNIX) then add the -f flag to the above command before the pod name, and it will provide the same functionality. It would look like:
$ kubectl logs -f apache-httpd-pod
In the event that you only want to view logs that have been generated within a certain time period, then you can use the --since flag to provide that functionality. This command will pull back all log entries created in the last hour.
$ kubectl logs --since= 1 h apache-httpd-pod
If the pod has multiple containers, and the logs you need are from just one of the containers, then the logs command allows for further refinement by appending -c container_name to the end of the command.
$ kubectl logs apache-httpd-pod -c httpd-server
Kubernetes has the ability to group pods into namespaces for segmentation and easier applications of things like role-based access control. Because of the sheer number of namespaces and pods that can often be in a Kubernetes cluster, it is a common occurrence to need to reference a pod or resource that is defined in another namespace. To access other namespaces without changing your default, you can add -n namespace_name to the beginning of a kubectl command to context switch.
$ kubectl -n f5- namespace logs nginx-pod
There are multiple other options available within logs that can be useful, including displaying logs from pods that are part of a specific deployment.
$ kubectl logs deployment/random-deployment
Beyond the logs, which have some traces in them, if you want to get more metrics to see the holistic view of the cluster and get closer to the idea of the Three Pillars of Observability, you can use additional commands like kubectl get pods to list running pods and kubectl top to see how many resources are being used by individual pods or nodes in the cluster.
To show what logging looks like in Kubernetes, we first need to create a pod that will generate logs. For this purpose, we will create a simple pod using busybox that will run a continuous loop, and output the current date and time every second.
The command
$ cat <<EOF | kubectl apply -f -
apiVersion: v1
kind: Pod
metadata:
name: counter
spec:
containers:
- name: count
image: busybox
args: [/bin/sh, -c,
'i=0; while true; do echo "$i: $(date)"; i=$((i+1)); sleep 1; done']
EOF
Will create one pod
pod/counter created
The output from these logs will look like
$ kubectl logs counter
0: Mon Jan 1 00:00:00 UTC 2001
1: Mon Jan 1 00:00:01 UTC 2001
2: Mon Jan 1 00:00:02 UTC 2001
Next step is to configure node-level logging so we can see and ship all the logs on each node to a central server. To do this with Fluentd requires it to have a namespace, a secret with several variables set for things like log target and api keys, and finally the actual deployment of Fluentd using something like a DaemonSet so it runs on every node. Explicit details on the installation are maintained by Sumo Logic on GitHub.
In the event that logs are produced outside of stdout and stderr, the pod will need to mount a local volume on the node so the logs are available outside of the running containers and then the logging agent - in this case Fluentd - can be configured to pick up those log files. This is done by adding a new source section to the fluentd.conf file, and restarting the service. Specific details on how this would work are located in Fluentd's documentation. The below example would pick up an Apache access_log.
<source>
@type tail
path /mnt/apache-httpd-pod/httpd-server/access_log
pos_file /var/log/td-agent/apache2.access_log.pos
<parse>
@type apache2
</parse>
</source>
There are two ways to enable collection of logs for Sumo Logic . The first is via Helm, to install and configure the Kubernetes cluster directly, which will be the method recommended for most deployments using vanilla Kubernetes or an offering from a public cloud provider like EKS or GKE.
The second way is to leverage tools that may already be active in the cluster, like Prometheus. This will be preferred when the Kubernetes cluster is in one of the distributions that target on-premise enterprise deployments, like Red Hat OpenShift, so they automatically configure advanced monitoring services as part of cluster creation.
Sumo Logic has a platform that really helps companies see all Three Pillars of Observability , which are logs, metrics, and traces. The Kubernetes application, which Sumo Logic has created for their platform, actively ingests metrics and logs into their platform from connected Kubernetes clusters so they can be processed and then visualized through both predefined and custom-made dashboards to increase transparency and expose the important information from Kubernetes - like detailed cluster health and resource utilization - in addition to building trends that allow for earlier detection of anomalies in the monitored clusters.
In addition to visualization, once the data from Kubernetes has been processed in the Sumo Logic platform, it can also be queried using Sumo Logic's powerful query language, to make analysis easier and give the ability to correlate data from additional log sources to provide a holistic view of your infrastructure.
Kubernetes is a powerful tool that greatly simplifies the process of deploying complex containerized applications at scale. Yet, like any powerful software platform, Kubernetes must be monitored effectively in order to do its job well. Without the right Kubernetes monitoring tools and procedures in place, teams risk sub-optimal performance or even complete failure of their Kubernetes-based workloads.
To help get started building and implementing a Kubernetes monitoring strategy, this page breaks down the different parts of Kubernetes and explains how to monitor each. It also discusses key Kubernetes monitoring metrics and offers tips on best practices that will help you get the most out of your Kubernetes monitoring strategy.
Now that we know what goes into monitoring Kubernetes, let's discuss how to monitor all of the pieces. In order to simplify your Kubernetes monitoring strategy, it's helpful to break monitoring operations down into different parts, each focused on a different "layer" of your Kubernetes environment or part of the overall workload (clusters, pods, applications and the end-user experience).
The highest-level component of Kubernetes is the cluster. As noted above, in most cases each Kubernetes installation consists of only one cluster. Thus, by monitoring the cluster, you gain an across-the-board view of the overall health of all of the nodes, pods and applications that form your cluster. (If you use federation to maintain multiple clusters, you'll have to monitor each cluster separately. But that is not very difficult, especially because it would be very rare to have more than two or three clusters per organization.)
Specific areas to monitor at the cluster level include:
Cluster usage: Which portion of your cluster infrastructure is currently in use? Cluster usage lets you know when it's time to add more nodes so that you don't run out of resources to power your workloads. Or, if your cluster is significantly under-utilized, tracking cluster usage will help you know it's time to scale down so that you're not paying for more infrastructure than you need.
Node consumption: You should also track the load on each node. If some nodes are experiencing much more usage than others, you may want to rebalance the distribution of workloads using DaemsonSets.
Failed pods: Pods are destroyed naturally as part of normal operations. But if there is a pod that you think should be running but is not active anywhere on your cluster, that's an important issue to investigate.
While cluster monitoring provides a high-level overview of your Kubernetes environment, you should also collect monitoring data from individual pods. This data will provide much deeper insight into the health of pods (and the workloads that they host) than you can glean by simply identifying whether or not pods are running at the cluster level.
When monitoring pods, you'll want to focus on:
Pod deployment patterns: Monitoring how pods are being deployed - which nodes they are running on and how resources are distributed to them - helps identify bottlenecks or misconfigurations that could compromise the high availability of pods.
Total pod instances: You want enough instances of a pod to ensure high availability, but not so many that you waste hosting resources running more pod instances than you need.
Expected vs. actual pod instances: You should also monitor how many instances for each pod are actually running, and compare it to how many you expected to be running. If you find that these numbers are frequently different, it could be a sign that your ReplicaSets are misconfigured and/or that your cluster does not have enough resources to achieve the desired state regarding pod instances.
Although applications are not a specifically defined component within Kubernetes, hosting applications is a reason why you ultimately use Kubernetes in the first place. Thus, it's important to monitor the applications being hosted on your cluster (or clusters) by checking:
Application availability: Are your apps actually up and responding?
Application responsiveness: How long do your apps take to respond to requests? Do they struggle to maintain acceptable rates of performance under heavy load?
Transaction traces: If your apps are experiencing performance or availability problems, transaction traces can help to troubleshoot them.
Errors: When application errors occur, it's important to get to the bottom of them before they impact end-users.
Problems revealed by application monitoring in Kubernetes could be the result of an issue with your Kubernetes environment, or they could be rooted in your application code itself. Either way, you'll want to be sure to identify the problem so you can correct it.
Like applications, the end-user experience is not a technical part of the Kubernetes platform. But delivering a positive experience for end-users - meaning the people who use the applications hosted on Kubernetes - is a critical consideration for any successful Kubernetes strategy.
Toward that end, it's important to collect data that provides insight into the performance and usability of applications. We discussed some of this above in the context of monitoring for application responsiveness, which provides insight into performance. When it comes to assessing usability, performing both synthetic and real-user monitoring is critical for understanding how users are interacting with Kubernetes workloads and whether there are any adjustments you can make within Kubernetes (such as enhancing your application frontend) to improve usability.
In addition to the various Kubernetes monitoring considerations described above, which apply to any type of Kubernetes environment, there are some special factors to weigh when you're running Kubernetes in the cloud.
In a cloud-based installation, you'll also need to monitor for:
Cloud APIs: Your cloud provider has its own APIs, which your Kubernetes installation will use to request resources.
IAM events: Monitoring for IAM activity, like logins or permissions changes, is important for staying on top of security in a cloud-based environment.
Cost: Cloud bills can get large quickly. Performing cost monitoring will help ensure you are not overspending on your cloud-based Kubernetes service.
Network performance: In the cloud, the network is often the biggest performance bottleneck for your applications. Monitoring the cloud network to ensure that it is moving data as quickly as you need, helps to safeguard against network-related performance issues.
With your load balancer configured, you can trust that requests to your services will be dispatched efficiently, ensuring smoother performance and enabling you to handle greater loads. For many of us, however, trust must be earned, and "seeing is believing," as the old adage goes.
If you want to see your load balancer in action so that you know it's operating as it should, you need a way to visualize your Kubernetes services and monitor their performance. The Sumo Logic Kubernetes App provides visibility on all your nodes, allowing you to monitor and troubleshoot load balancing as well as myriad other metrics to track the health of your clusters. You can track the loads being placed on each service to verify that resources are being shared evenly, and you can also monitor the load-balancing service itself from a series of easy-to-understand dashboards.
If your application must handle an unpredictable number of requests, a load balancer is essential for ensuring reliable performance without the cost of over-provisioning. Depending on the number of services you need to route traffic to, as well as the level of complexity you are willing to accept, you might choose to use Ingress or the external load balancing service offered by your cloud provider. Regardless of how you implement your load balancing, monitoring its performance through the Sumo Logic Kubernetes App will allow you to measure its benefits and quickly react when it is not operating as it should.
Now that we know which types of monitoring to perform for Kubernetes, let's discuss the specific metrics to collect in order to achieve visibility into a Kubernetes installation.
Common metrics refer to metrics you can collect from the code of Kubernetes itself, which is written in Golang. This information helps you understand what is happening deep under the hood of Kubernetes.
Metric | Components | Description |
go_gc_duration_seconds | All | A summary of the GC invocation durations |
go_threads | All | Number of OS threads created |
go_goroutines | All | Number of goroutines that currently exist |
etcd_helper_cache_hit_count | API Server, Controller Manager | Counter of etcd helper cache hits |
etcd_helper_cache_miss_count | API Server, Controller Manager | Counter of etcd helper cache misses |
etcd_request_cache_add_latencies_summary | API Server, Controller Manager | Latency in microseconds of adding an object to etcd cache |
etcd_request_cache_get_latencies_summary | API Server, Controller Manager | Latency in microseconds of getting an object from etcd cache |
etcd_request_latencies_summary | API Server, Controller Manager | Etcd request latency summary in microseconds for each operation and object type |
Since APIs serve as the glue that binds the Kubernetes frontend together, API metrics are crucial for achieving visibility into the API Server - and, by extension, into your entire frontend.
Metric | Description |
apiserver_request_count | Count of apiserver requests broken out for each verb, API resource, client, and HTTP response contentType and code |
apiserver_request_latencies | Response latency distribution in microseconds for each verb, resource and subresource |
Since Etcd stores all of the configuration data for Kubernetes itself, Etcd metrics deliver critical visibility into the state of your cluster.
Metric | Description |
etcd_server_has_leader | 1 if a leader exists, 0 if not |
etcd_server_leader_changes_seen_total | Number of leader changes |
etcd_server_proposals_applied_total | Number of proposals that have been applied |
etcd_server_proposals_committed_total | Number of proposals that have been committed |
etcd_server_proposals_pending | Number of proposals that are pending |
etcd_server_proposals_failed_total | Number of proposals that have failed |
etcd_debugging_mvcc_db_total_size_in_bytes | Actual size of database usage after a history compaction |
etcd_disk_backend_commit_duration_seconds | Latency distributions of commit called by the backend |
etcd_disk_wal_fsync_duration_seconds | Latency distributions of fsync calle by wal |
etcd_network_client_grpc_received_bytes_total | Total number of bytes received by gRPC clients |
etcd_network_client_grpc_sent_bytes_total | Total number of bytes sent by gRPC clients |
grpc_server_started_total | Total number of gRPC’s started on the server |
grpc_server_handled_total | Total number of gRPC’s handled on the server |
Monitoring latency in the Scheduler helps identify delays that may arise and prevent Kubernetes from deploying pods smoothly.
Metric | Description |
scheduler_e2e_scheduling_latency_microseconds | The end-to-end scheduling latency, which is the sum of the scheduling algorithm latency and the binding latency |
Watching the requests that the Controller makes to external APIs helps ensure that workloads can be orchestrated successfully, especially in cloud-based Kubernetes deployments.
Metric | Description |
cloudprovider_*_api_request_duration_seconds | The latency of the cloud provider API call |
cloudprovider_*_api_request_errors | Cloud provider API request errors |
Kube-State-Metrics is an optional Kubernetes add-on that generates metrics from the Kubernetes API. These metrics cover a range of resources, below are the most valuable ones.
Metric | Description |
kube_pod_status_phase | The current phase of the pod |
kube_pod_container_resource_limits_cpu_cores | Limit on CPU cores that can be used by the container |
kube_pod_container_resource_limits_memory_bytes | Limit on the amount of memory that can be used by the container |
kube_pod_container_resource_requests_cpu_cores | The number of requested cores by a container |
kube_pod_container_resource_requests_memory_bytes | The number of requested memory bytes by a container |
kube_pod_container_status_ready | Will be 1 if the container is ready, and 0 if it is in a not ready state |
kube_pod_container_status_restarts_total | Total number of restarts of the container |
kube_pod_container_status_terminated_reason | The reason that the container is in a terminated state |
kube_pod_container_status_waiting | The reason that the container is in a waiting state |
kube_daemonset_status_desired_number_scheduled | The number of nodes that should be running the pod |
kube_daemonset_status_number_unavailable | The number of nodes that should be running the pod, but are not able to |
kube_deployment_spec_replicas | The number of desired pod replicas for the Deployment |
kube_deployment_status_replicas_unavailable | The number of unavailable replicas per Deployment |
kube_node_spec_unschedulable | Whether a node can schedule new pods or not |
kube_node_status_capacity_cpu_cores | The total CPU resources available on the node |
kube_node_status_capacity_memory_bytes | The total memory resources available on the node |
kube_node_status_capacity_pods | The number of pods the node can schedule |
kube_node_status_condition | The current status of the node |
Monitoring the Kubelet agent will help ensure that the Control Plane can communicate effectively with each of the nodes that Kubelet runs on. Beyond the common GoLang runtime metrics described above, Kubelet exposes some internals about its actions that are good to track as well.
Metric | Description |
kubelet_running_container_count | The number of containers that are currently running |
kubelet_runtime_operations | The cumulative number of runtime operations available by the different operation types |
kubelet_runtime_operations_latency_microseconds | The latency of each operation by type in microseconds |
Monitoring standard metrics from the operating systems that power Kubernetes nodes provide insight into the health of each node. Common node metrics to monitor include CPU load, memory consumption, filesystem activity and usage and network activity.
While metrics from Kubernetes can provide insight into many parts of your workload, you should also home in on individual containers to monitor for resource consumption. CAdvisor, which analyzes resource usage inside containers, is helpful for this purpose.
When you need to investigate an issue revealed by metrics, logs are invaluable for diving deeper by collecting information that goes beyond metrics themselves. Kubernetes offers a range of logging facilities for most of its components. Applications themselves also typically generate log data.
With the Sumo Logic Kubernetes App, collecting and analyzing monitoring data from across your Kubernetes environment is simple. Sumo Logic does the hard work of collecting metrics from Kubernetes' many different parts, then aggregates them and provides you with data analytics tools for making sense of all of the data.
Just as Kubernetes makes it practical to manage complex containerized applications at scale, Sumo Logic makes it possible to monitor Kubernetes itself - a task that would be all but impossible without Sumo Logic's ability to streamline the monitoring and analytics process.
Reduce downtime and move from reactive to proactive monitoring.
Monitor, troubleshoot and secure your Kubernetes clusters with Sumo Logic cloud-native SaaS analytics solution for K8s.
Learn more