
2022 Gartner® Magic Quadrant™ SIEM
Get the report
MoreTrusted by thousands of customers globally.
Browse our library of ebooks, briefs, reports, case studies, webinars & more.
August 19, 2021
We all know how our life has changed in the last two decades in terms of how we interact with our vendors for day to day activities, regardless if we shop for a birthday present or read a newspaper. This digital transformation of everything we do increased even more during the pandemic, when it appeared that a malfunctioning digital access channel can often mean lack of possibility to enter certain places like even the country or a plane to get back home.
This digital transformation makes our life often easier, but also puts a lot of pressure on the application vendors, development and DevOps teams where the quality of their work and ability for a quick turn around in case of troubles, affects more and more people in more and more serious ways. This responsibility needs more automation, intelligent decision support and these in turn - better visibility and input data for analysis.
One of the areas of application Observability that is required, and very often used as a starting point for problem detection and diagnosis is Real User Monitoring: a discipline that helps observers to understand how our users interact with the digital interfaces of our business: the apps, and if their experience is satisfactory or not. I have spent a considerable amount of time discussing this topic in one of my previous blogs, announcing Sumo Logic first steps in this discipline. I also ended that blog with a small glimpse of what was coming soon, so building on that promise it is my pleasure to announce we have made another big step towards completing modern, open-source powered, flexible and fully integrated Real User Monitoring capabilities for browsers.
Now, as a Sumo Logic customer, you are able not only get visibility into individual user transactions and quickly understand what was the user experience and delay incurred on the client to overall end to end transaction time, but also perform high level monitoring, alerting and troubleshooting of such situations. You have full visibility into user cohorts, their geographical locations, browsers, operating systems. You can also fully understand the overall experience of all users and transactions of your digital business, all the time.
Let’s see how you can solve real problems with this…
First and most important use case is to understand the overall level of user satisfaction when they navigate throughout your website. Response times are not enough. There may be many different factors that affect how the page renders inside the browser, and the only thing the end user cares about is when they can see some useful information and when they can start interacting with the page. There’s a whole chain of events that need to happen to get to that point: DNS resolution, SSL handshake, request, response, downloading all various elements of the page and finally the rendering of UI in the browser. Sumologic measures and allow you to inspect all of them, both in aggregated way on level of whole application, any single service or individual pages as well:
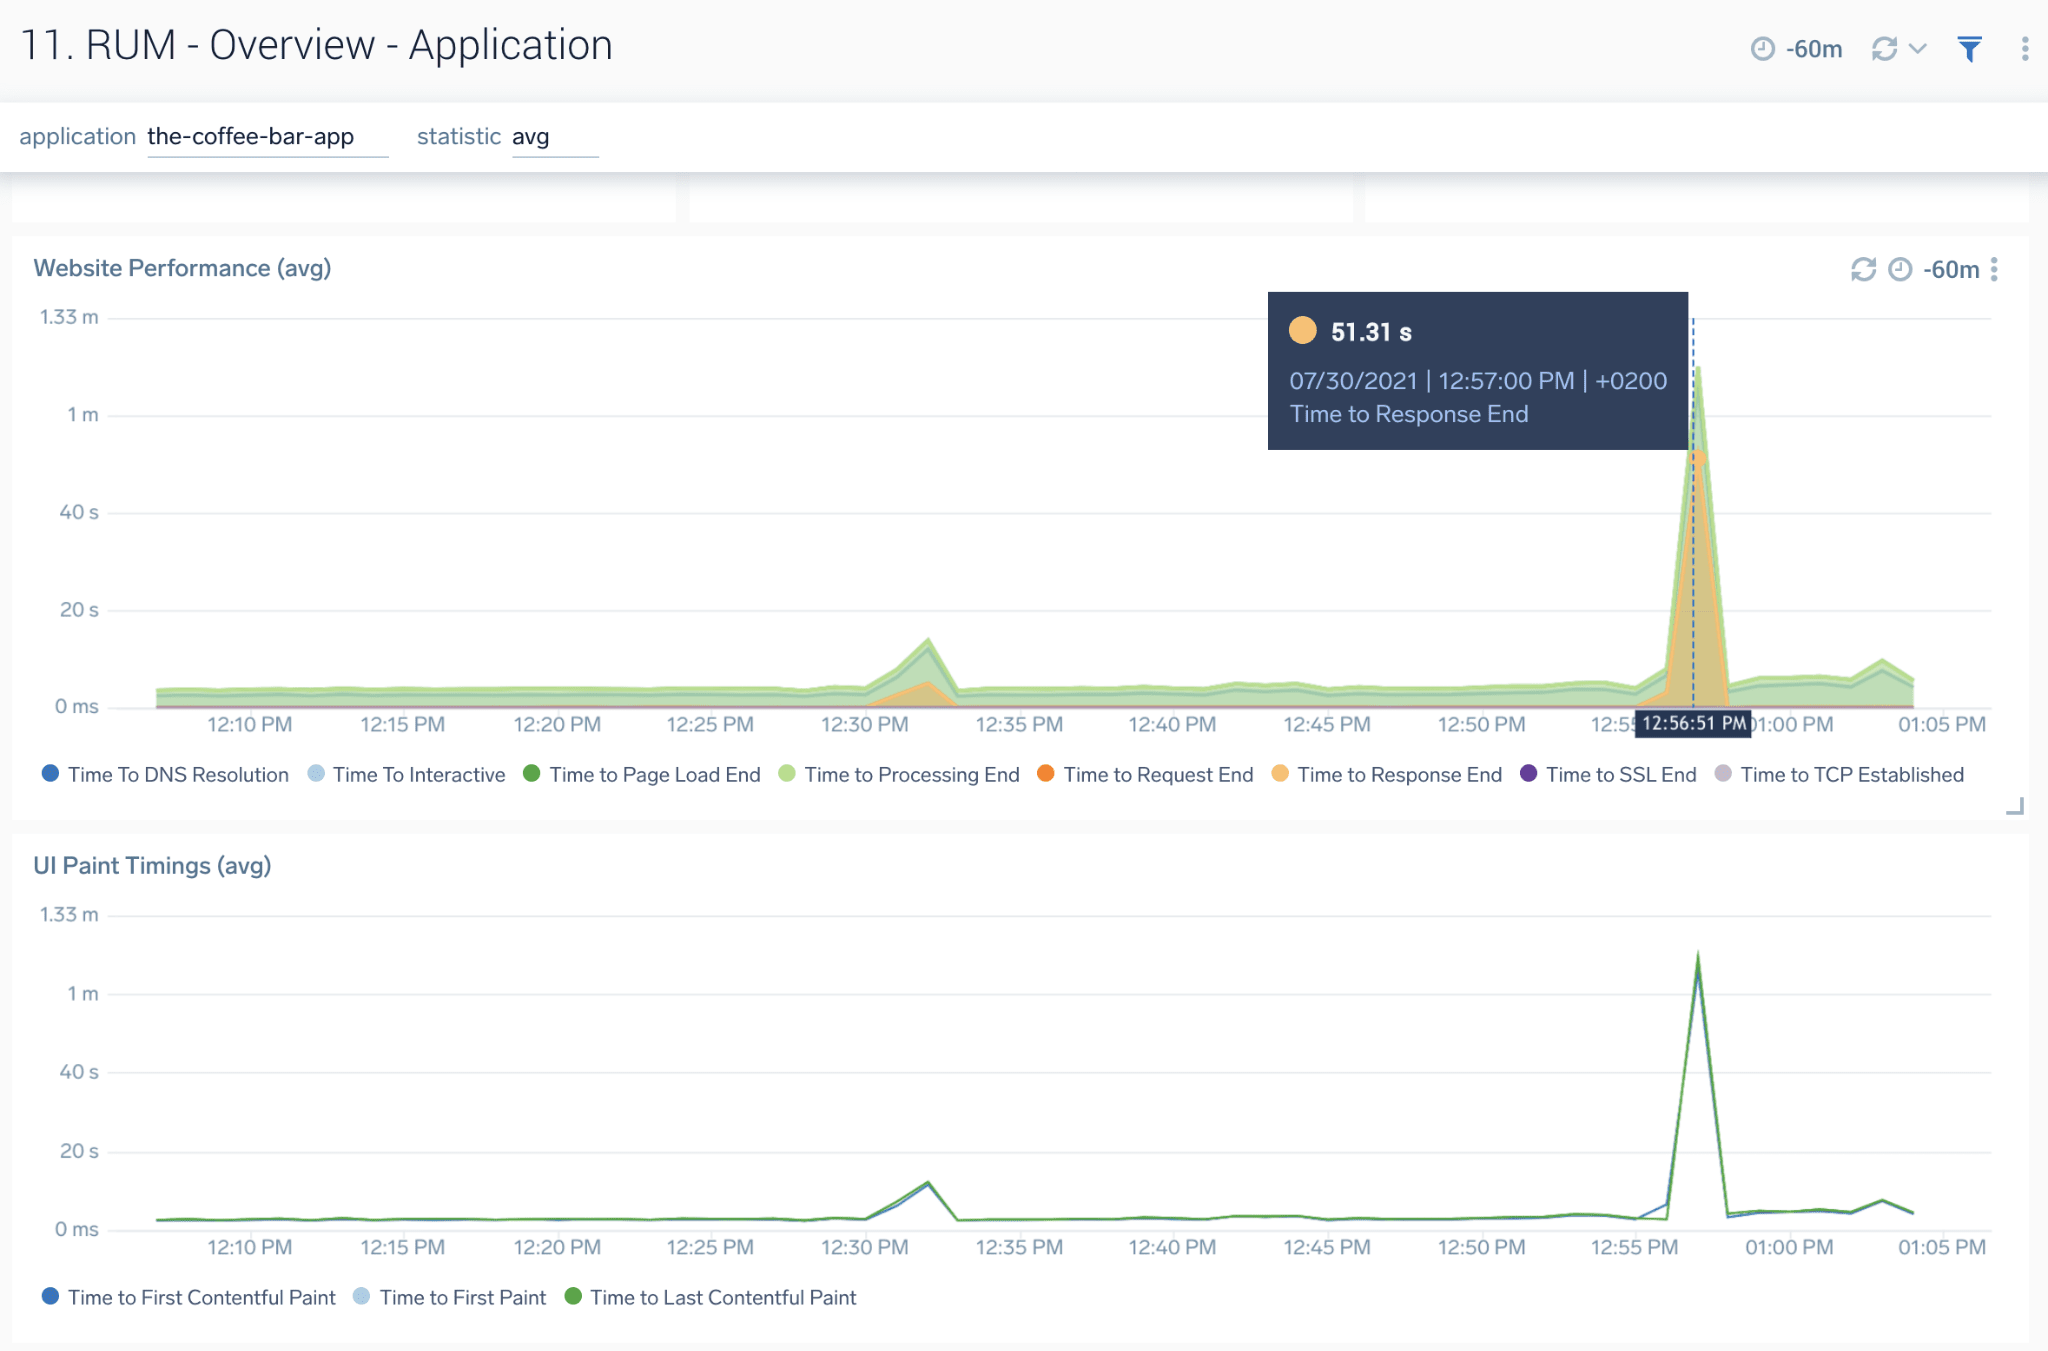
You can access these dashboards in Explore -> Real User Monitoring view. As we can see above we had a serious problem with our demo website where typically pages loaded and rendered in seconds, jumping both the overall load time as well as render time to over a minute with the majority spent in waiting for the response.
You can also analyse these metrics per different browsers, operating systems and geographical connections, so you can ensure all your users are getting the best experience regardless of the type of software they are running and their physical location:
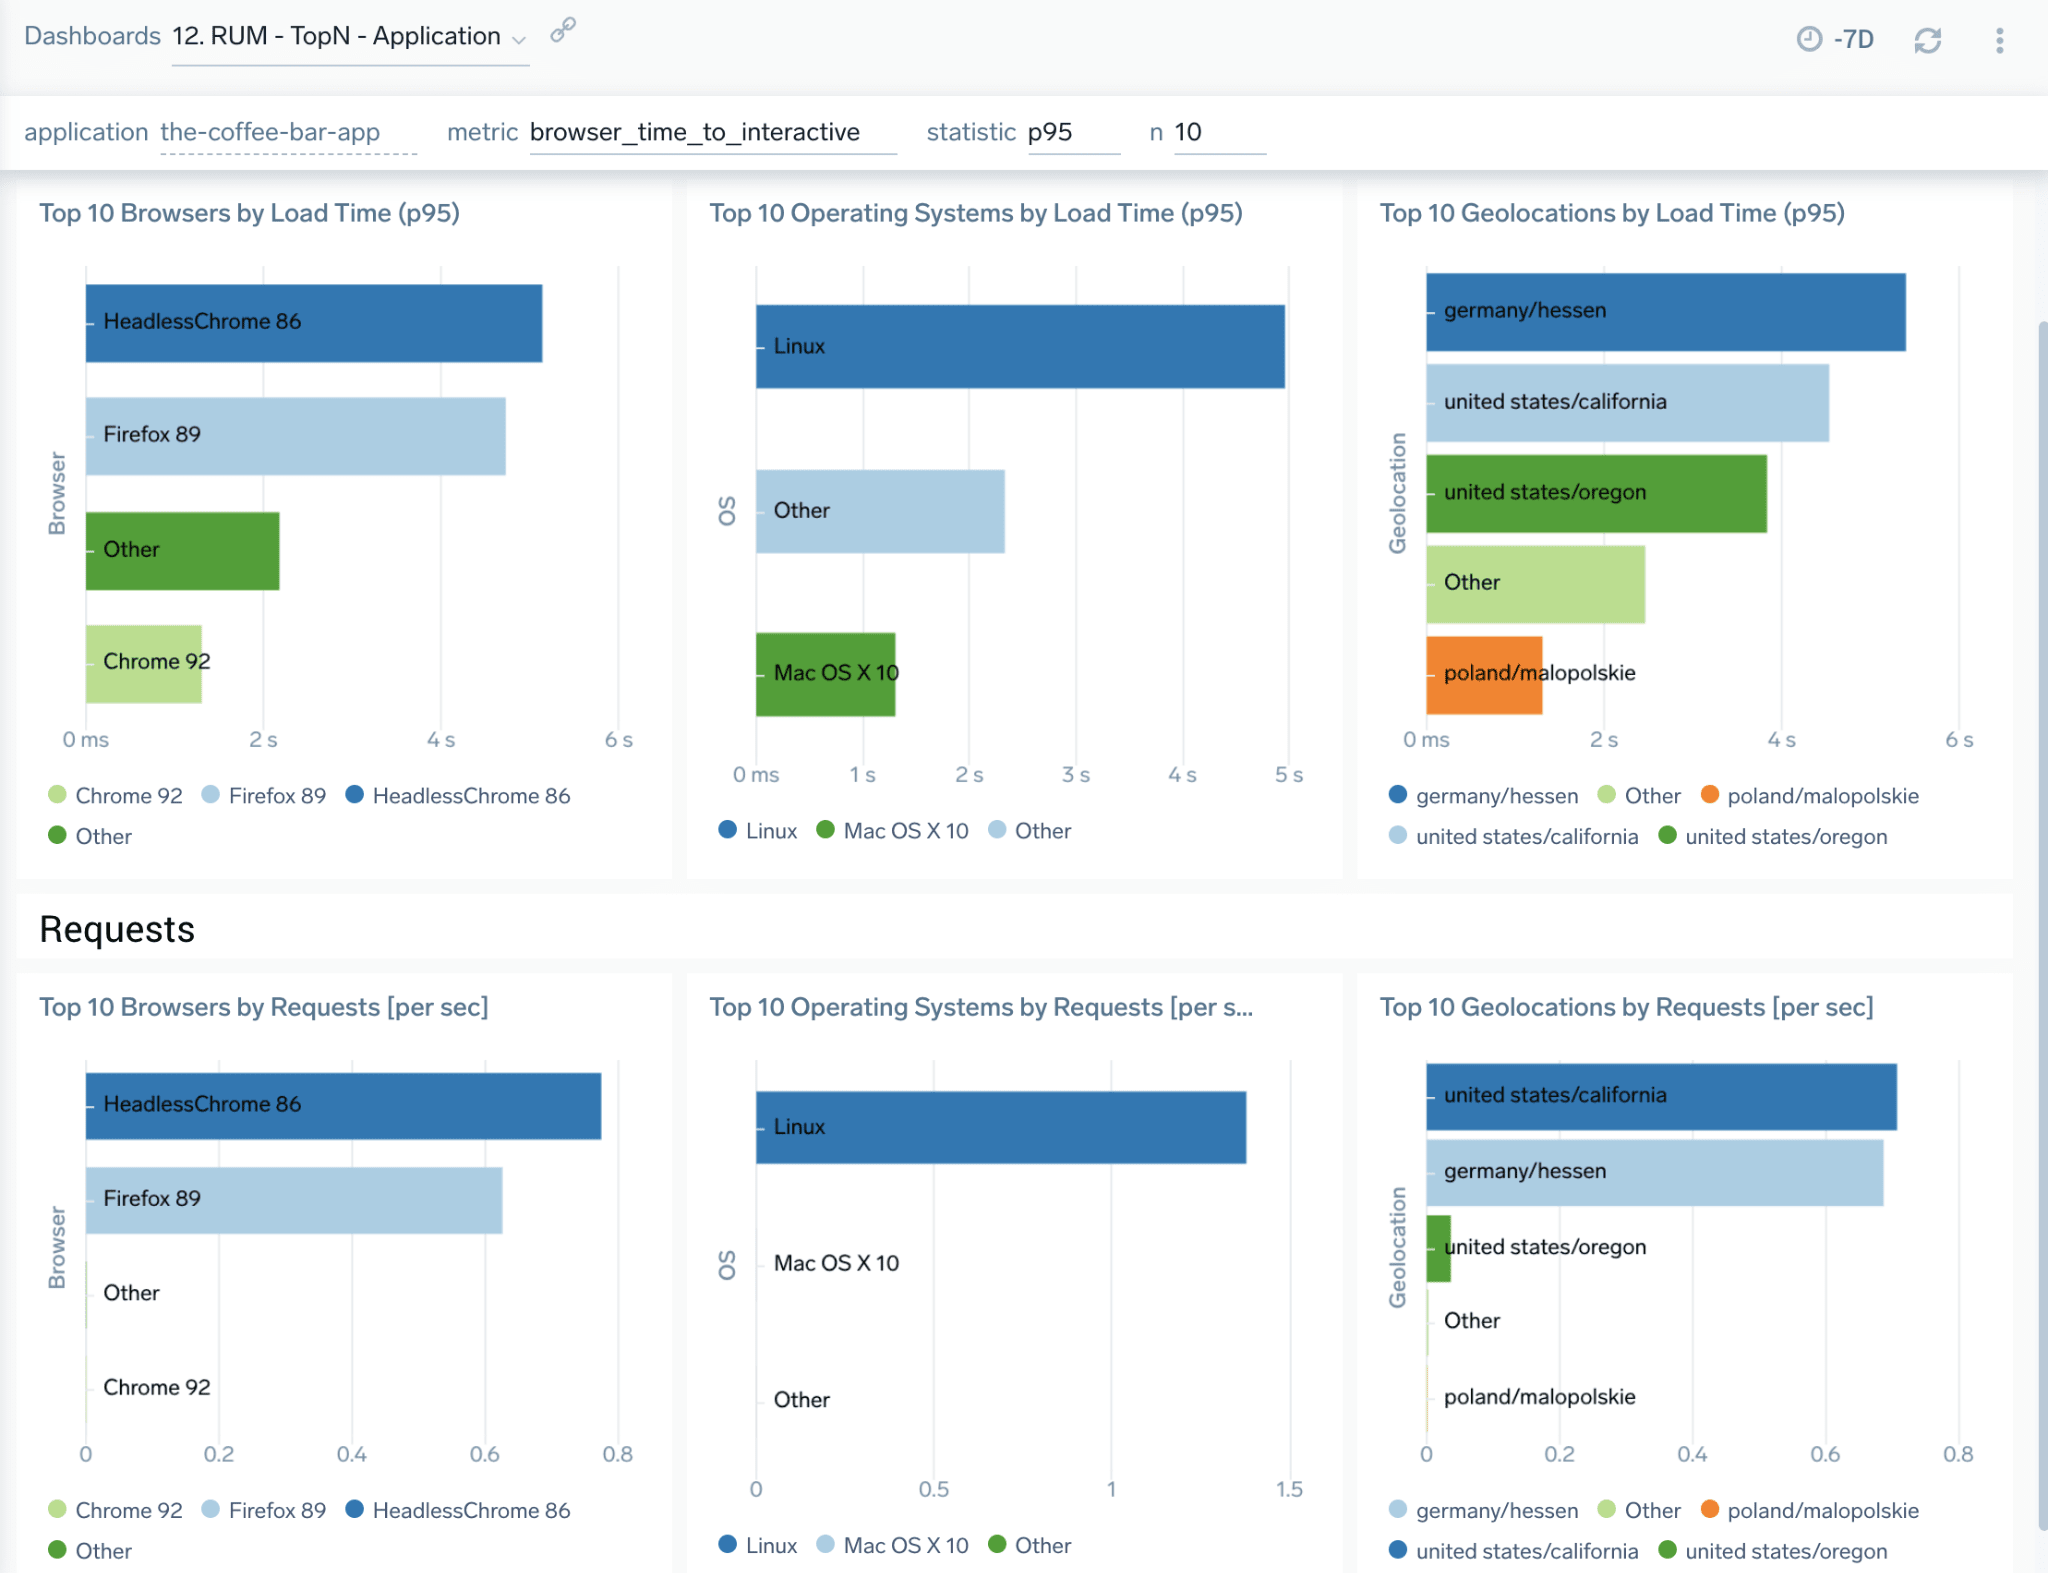
Here we can clearly see that users from the United States and Germany, although representing the majority of our users, also get the worst performance with regards to time to interactive (as chosen in the header). We also see that from this perspective, our pages work better on Chrome 92 than Firefox and also better on MacOs than Linux OSes.
By clicking at any of these data points above, you can inspect individual page loads in form of end to end trace, containing all load event timings and whole backend sub-trace.
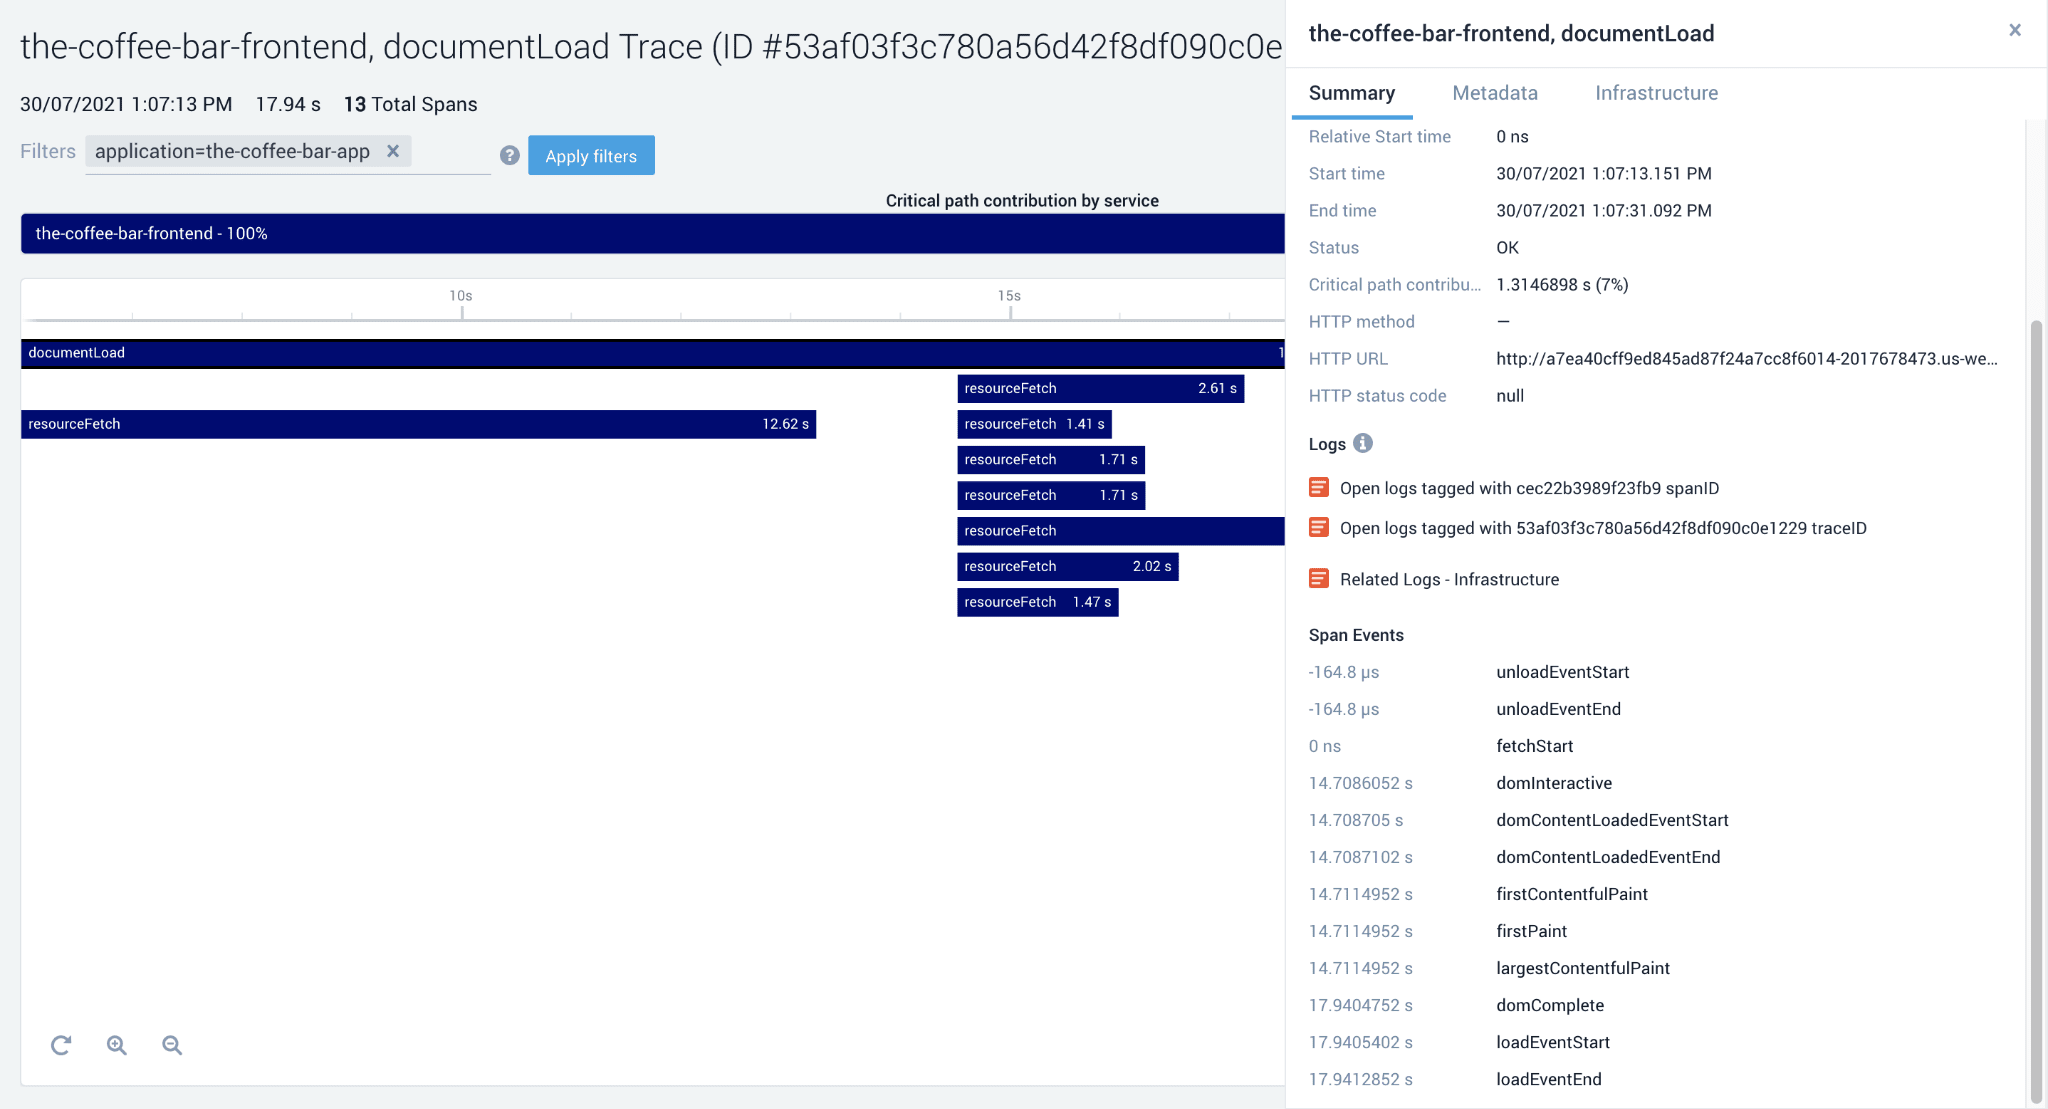
Above we can see the actual page load with all elements represented by spans, their load times and statuses, exact urls, response codes (if present), as well as all timing events for rendering in the panel on the right.
This can be done for both document load type of actions, as well as XHR/API type of calls that typically go to the backend. In the last case, of course, there’s no paint metrics.
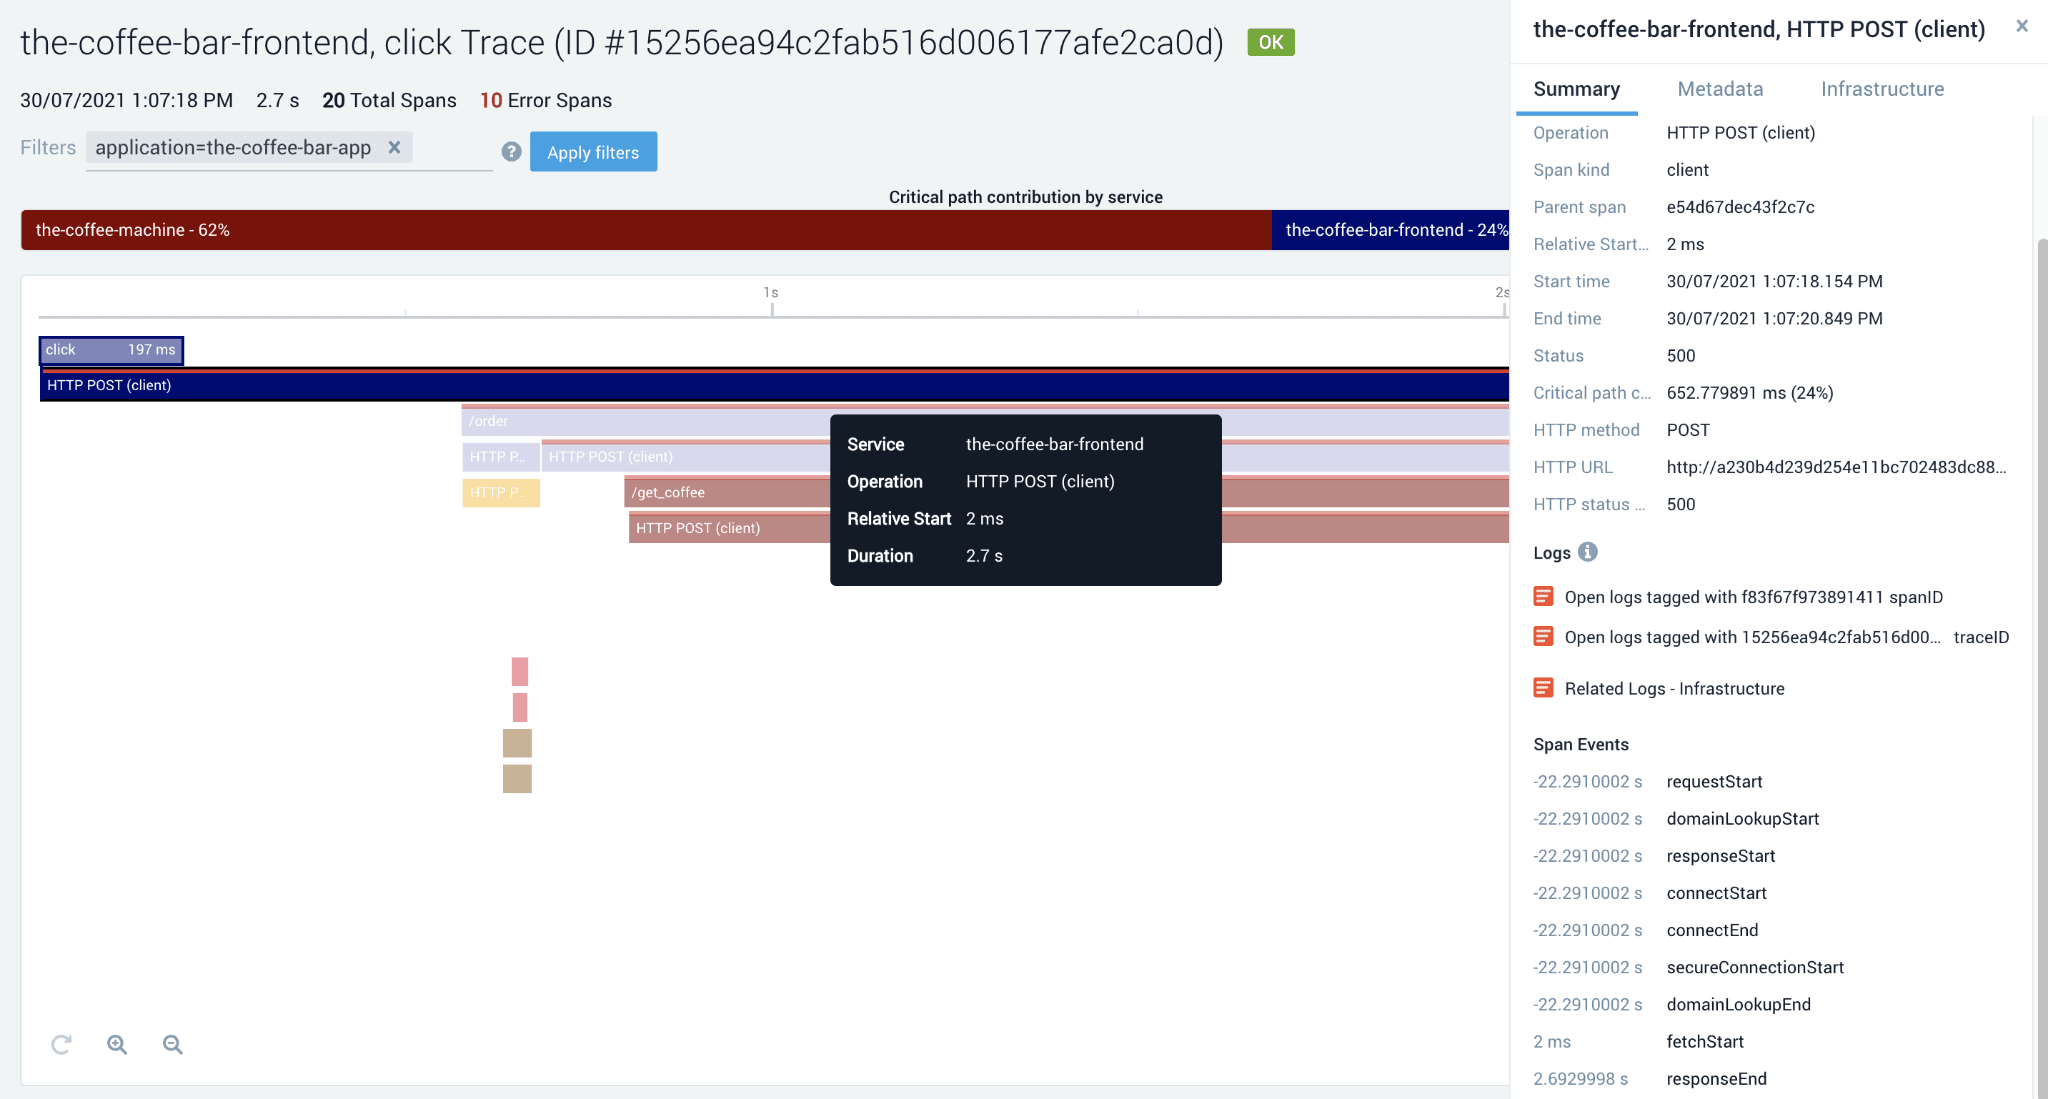
Here we can actually see that clicking on the “Order” button resulted in a wait time of around 2.5s where the majority of this time was spent in maroon-colored /get_cofee call of “the coffee-machine” service.
As you can see these new capabilities give an all around view into how your users are using, interacting and experiencing your digital channel of business. You have full control over how fast the pages are loading, rendering for them with full control over different browsers, operating systems, geographical locations. You have abilities to analyse these KPIs individually for any particular combinations of these dimensions and drilldown to all individual pages to inspect process of their load in details, including all page elements, browser timing events and even all backend trace to understand where to look for the problem and faster, easier diagnose and resolve any production issues.
If you would like to learn more about Real User Monitoring:
please refer to our documentation or
find us in #sumo-tracing Slack channel on Sumo Dojo (customers only) or
use the chat icon in the bottom right corner of your screen to reach out to us.
We are always looking for feedback and suggestions for the future. We will be soon enhancing these capabilities even more with support for Single Page Applications, XHR call metrics, error reporting and more, so stay tuned !
And, if you are new to APM or tracing in Sumo, make sure to take a look at this intro video, read this blog and get started here!
Reduce downtime and move from reactive to proactive monitoring.
Build, run, and secure modern applications and cloud infrastructures.
Start free trial
Group Product Manager
Besides sailing and horseback riding, Pawel was always passionate about great user experience. He spent many years working hands-on with the biggest IT organizations in the world, understanding their problems and challenges with digital transformation to help them exceed their customers expectations by building monitoring and observability products that win the market. Pawel joined Sumo in summer 2019 and is busy since then with extending our platform to cover APM/tracing use cases.
More posts by Pawel Brzoska.

No credit card required. Up and running in minutes.
More than 2,100 enterprises around the world rely on Sumo Logic to build, run, and secure their modern applications and cloud infrastructures.
