
2022 Gartner® Magic Quadrant™ SIEM
Get the report
MoreTrusted by thousands of customers globally.
Browse our library of ebooks, briefs, reports, case studies, webinars & more.
September 13, 2022
Monitoring the digital experience of users is a must-have these days. Ensuring the end clients are satisfied is difficult though. People are not keen to provide feedback; they just change the vendor without explanation. It is, therefore, crucial to build enough observability into a front-end application (a web page or a mobile UI) so it can tell the story of how well the user perceived the interaction within the application.
It’s almost exactly one year since we first announced our initial release of Sumo Logic Real User Monitoring (RUM) which addresses this exact problem. Since then we received good feedback from our first customers seeing enormous value in it, so today we are proud to announce a set of major improvements to this functionality, extending coverage and visibility of our RUM solution in the browser to the following areas:
Core web vital metrics for document loads
Single Page Apps support: monitoring of XHR calls and Route changes
Tracing browser freeze times: Longtask delays metrics
Better visualizations: Geolocation map
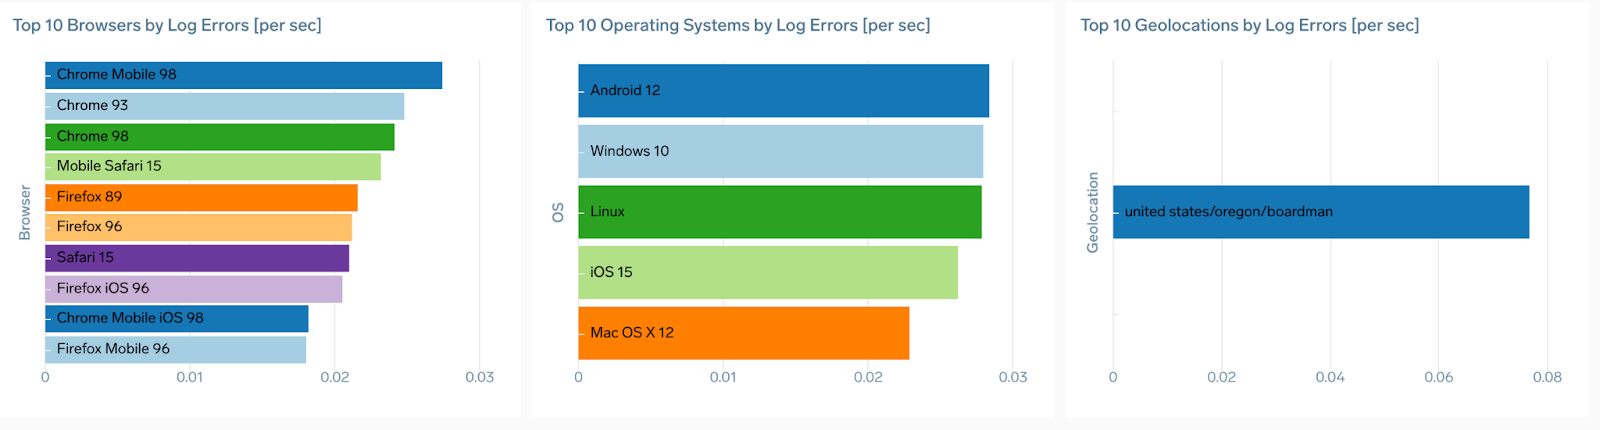
Browsers errors are captured and available in log index as well as on dashboards
Take a deep dive into Application Performance Monitoring (APM) and Real-User Monitoring (RUM). Our product team shares advancements we made in the product over the past year and roadmap items for the future.
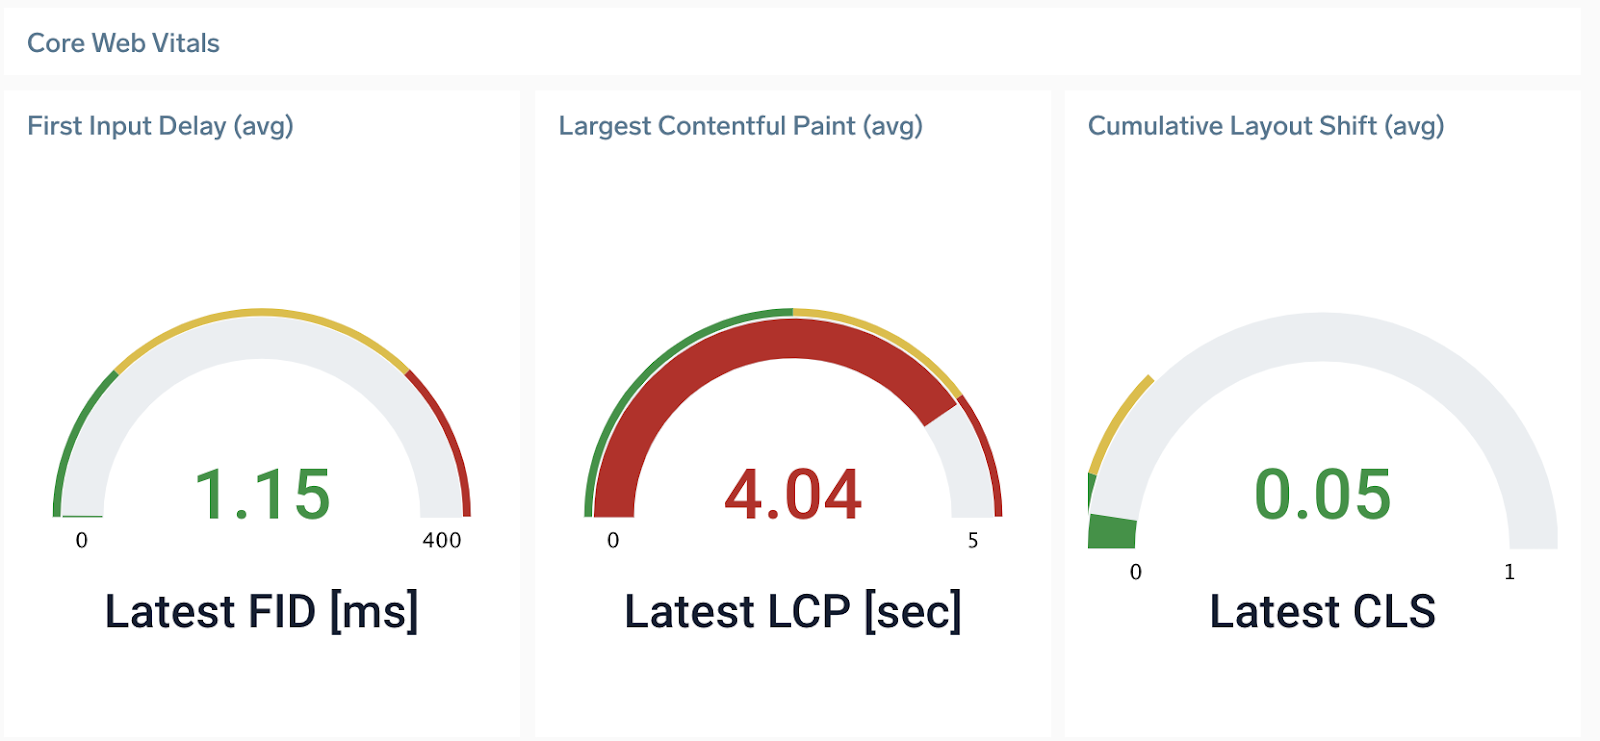
Core Web Vitals (CWV) is an initiative by Google that defines web page KPIs. Each of the CWVs represents a distinct facet of the user experience, is measurable in the field, and reflects the real-world experience of a critical user-centric outcome. CWV focuses on three aspects of the user experience—loading, interactivity, and visual stability—and includes the following metrics (and their respective thresholds):
Largest Contentful Paint (LCP): measures loading performance. To provide a good user experience, LCP should occur within 2.5 seconds of when the page first starts loading.
First Input Delay (FID): measures interactivity. To provide a good user experience, pages should have a FID of 100 milliseconds or less.
Cumulative Layout Shift (CLS): measures visual stability. To provide a good user experience, pages should maintain a CLS of 0.1. or less.
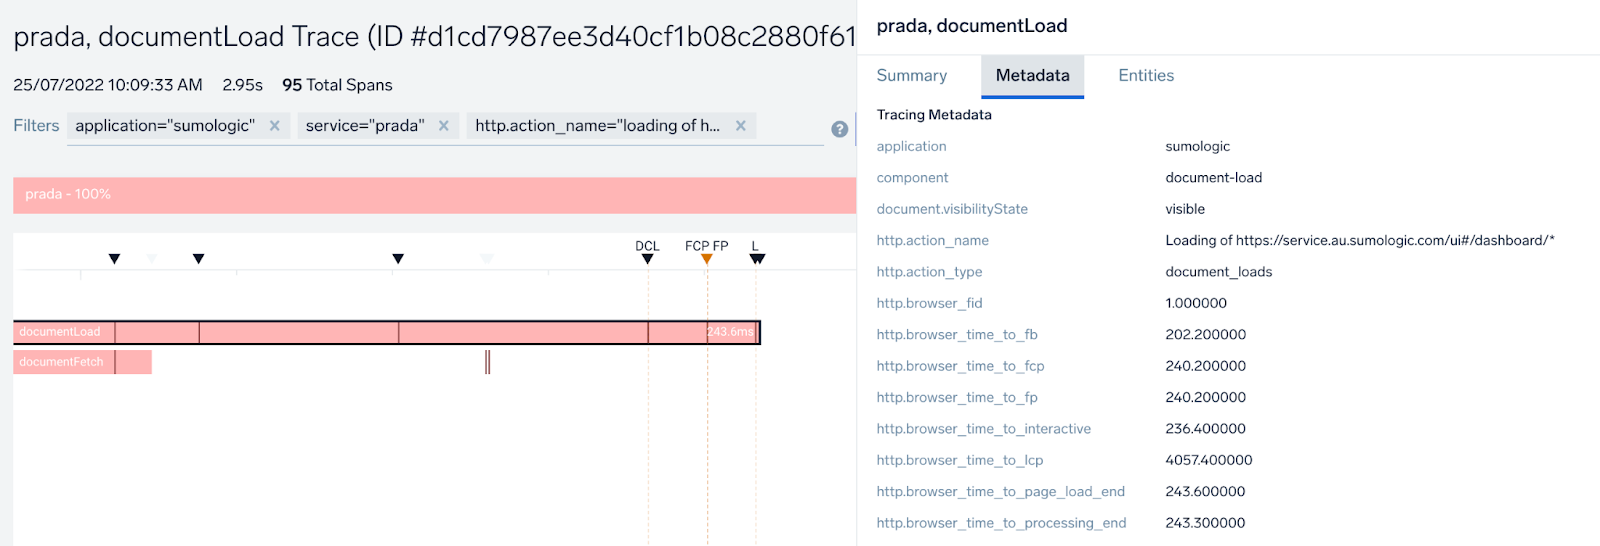
We capture all 3 CWV KPIs and display them on Overview dashboards for Document Load action types. Also, detailed metrics are available in span metadata for every transaction trace.
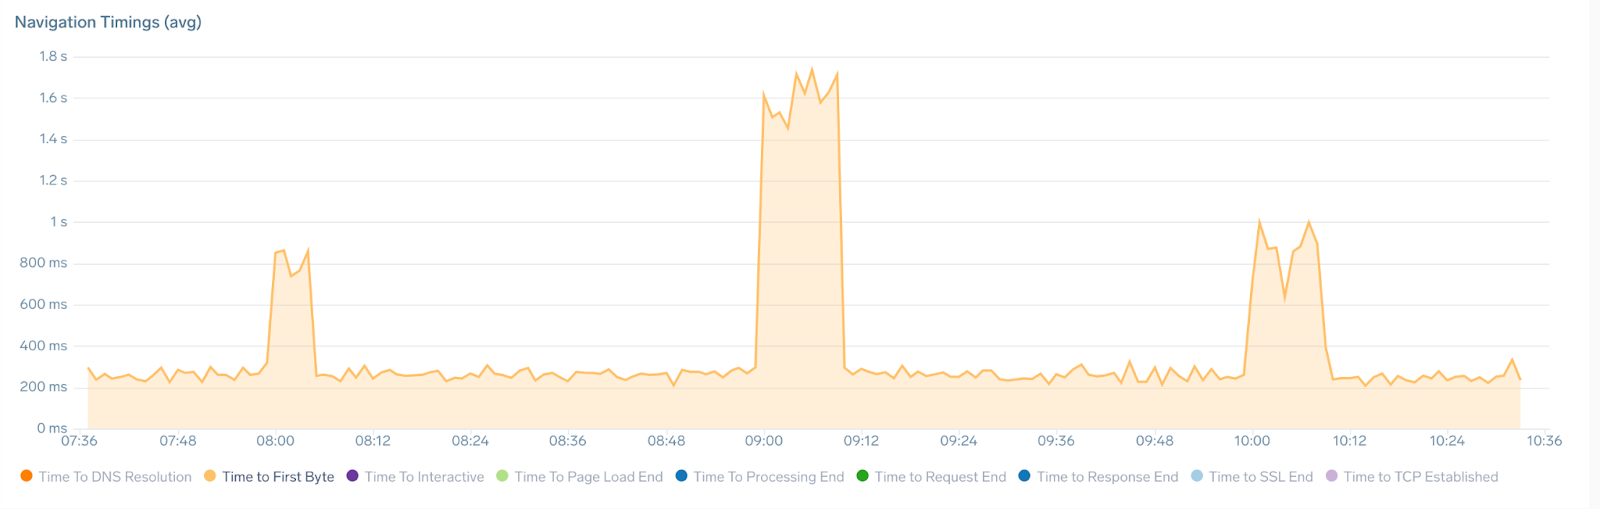
We have also added Time to First Byte (browser_time_to_fb), a new metric that measures the delay between start of the page load and moment when the first byte of the response appears. It helps identify when a web server is too slow to respond to requests. This metric has also been added to the existing Navigation Timings chart:
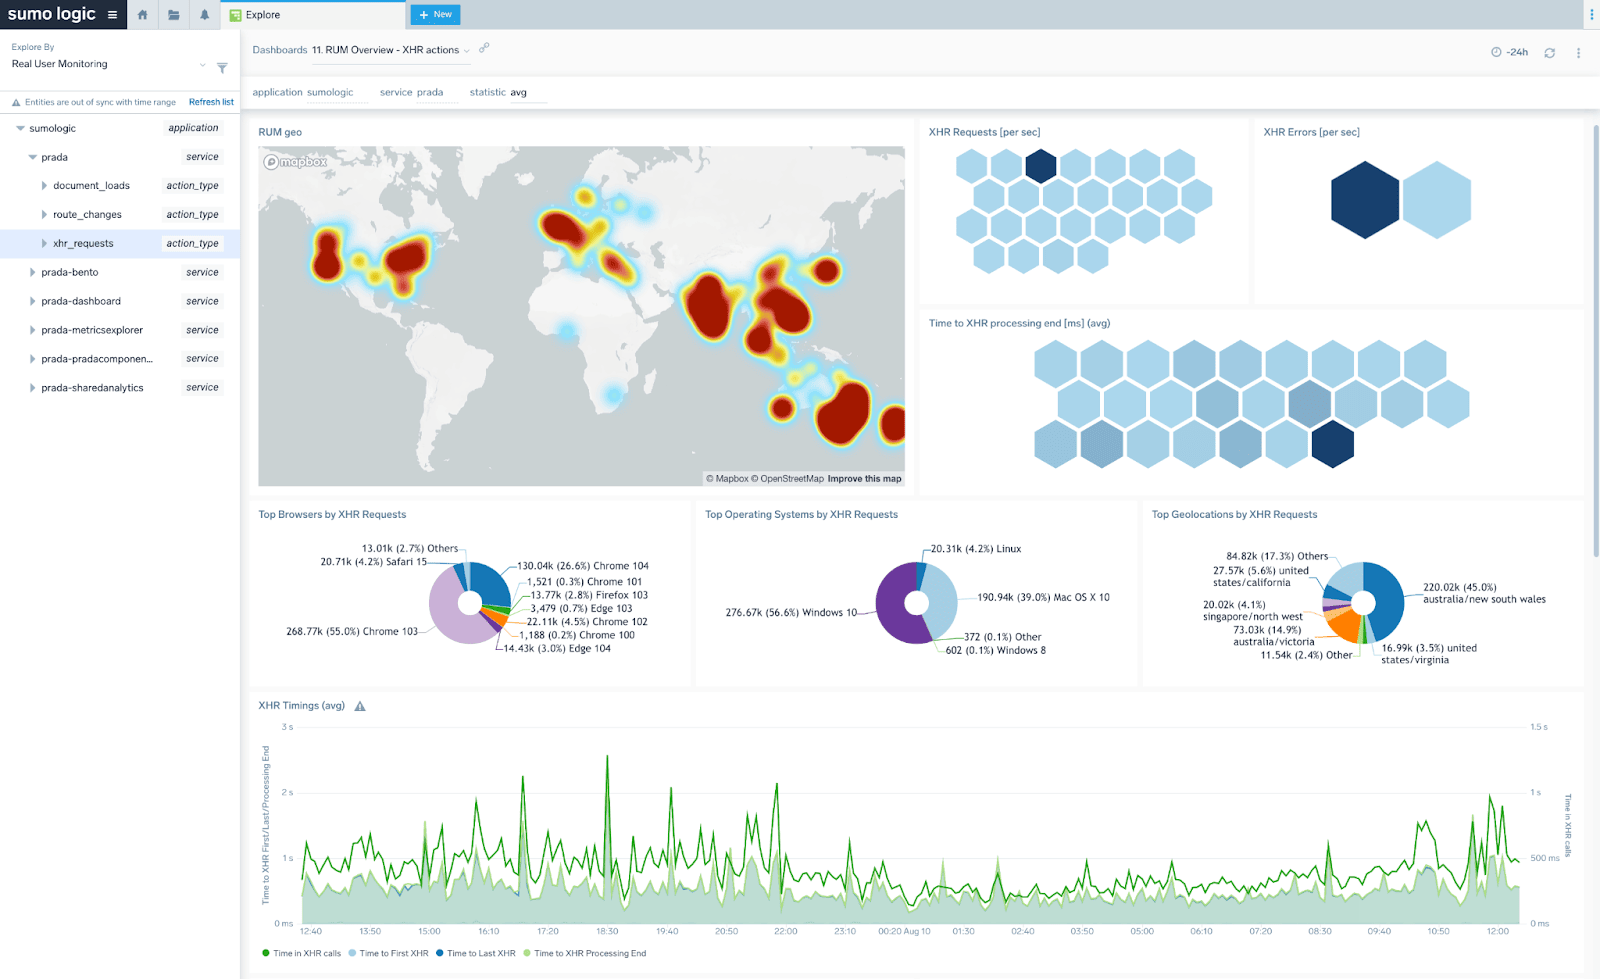
XHR stands for XML HTTP Request and is a form of communication between the browser and the application backend without (re)loading the page. A typical example is where a page needs to update a ticker of a price automatically or after pressing the “update price” button next to it.
Pages can generate one or more XHR requests, typically in the form of HTTP Posts, related to various user actions on a page. What we do with this is:
We measure how many XHR requests have been generated
We measure detailed XHR performance timings
We automatically identify the user action that triggered the XHRs
We measure any erroneous HTTP response to XHR POST calls and count them as XHR errors
We allow to drill-down to specific traces that explain full process of loading and execution of each such transaction
XHR technique is quite often used in Single Page Apps (apps that load the page once and then provide all interaction and navigation without loading more documents). Therefore having support for XHR is a key enabler to support SPA browser applications.
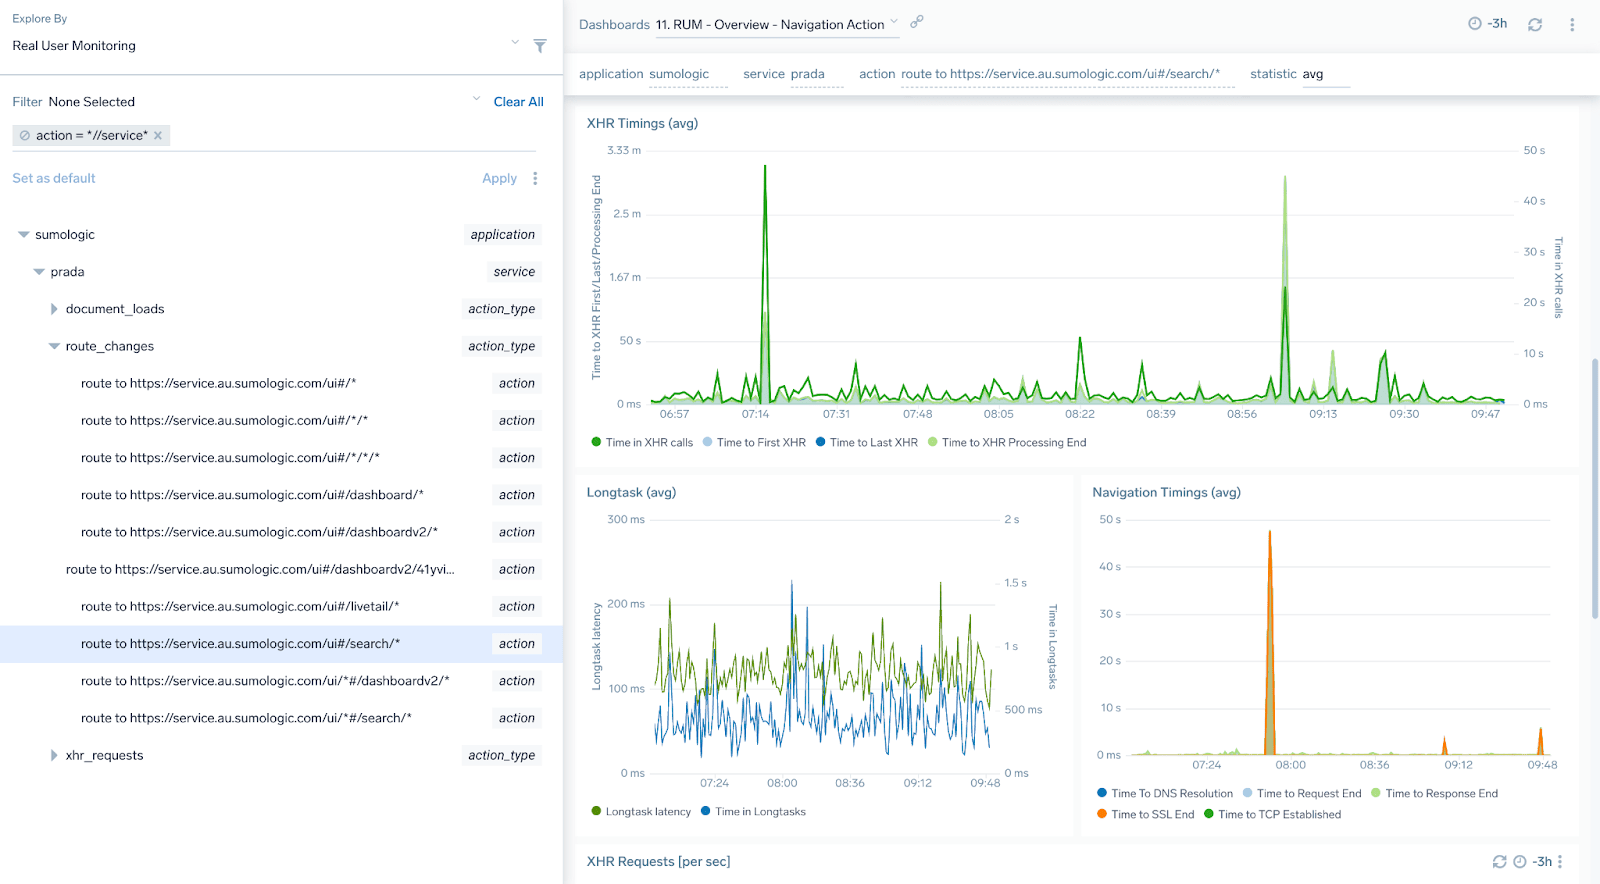
Another browsing technique used by Single Page Apps is a special way of handling page navigation (e.g. clicking on links, buttons, etc) called route change. It is basically a way to navigate to a new page/view without the need to load a new document. Every time we open a new tab in Sumo we do a route change (but we are not loading the whole document at the same time). Such actions typically also generate some XHR calls in the background.
What we do with this is:
We create a special type of user action called route_changes with the name of the page that is being opened (i.e. “Route to https://service.us2.sumologic....*”)
We show these actions as 3rd type of action next to document loads and XHR requests
We measure same type of metrics for them as for XHR requests
We allow to drill-down via Entities tab in right side panel to specific traces that explain full process of loading and execution of each such transaction
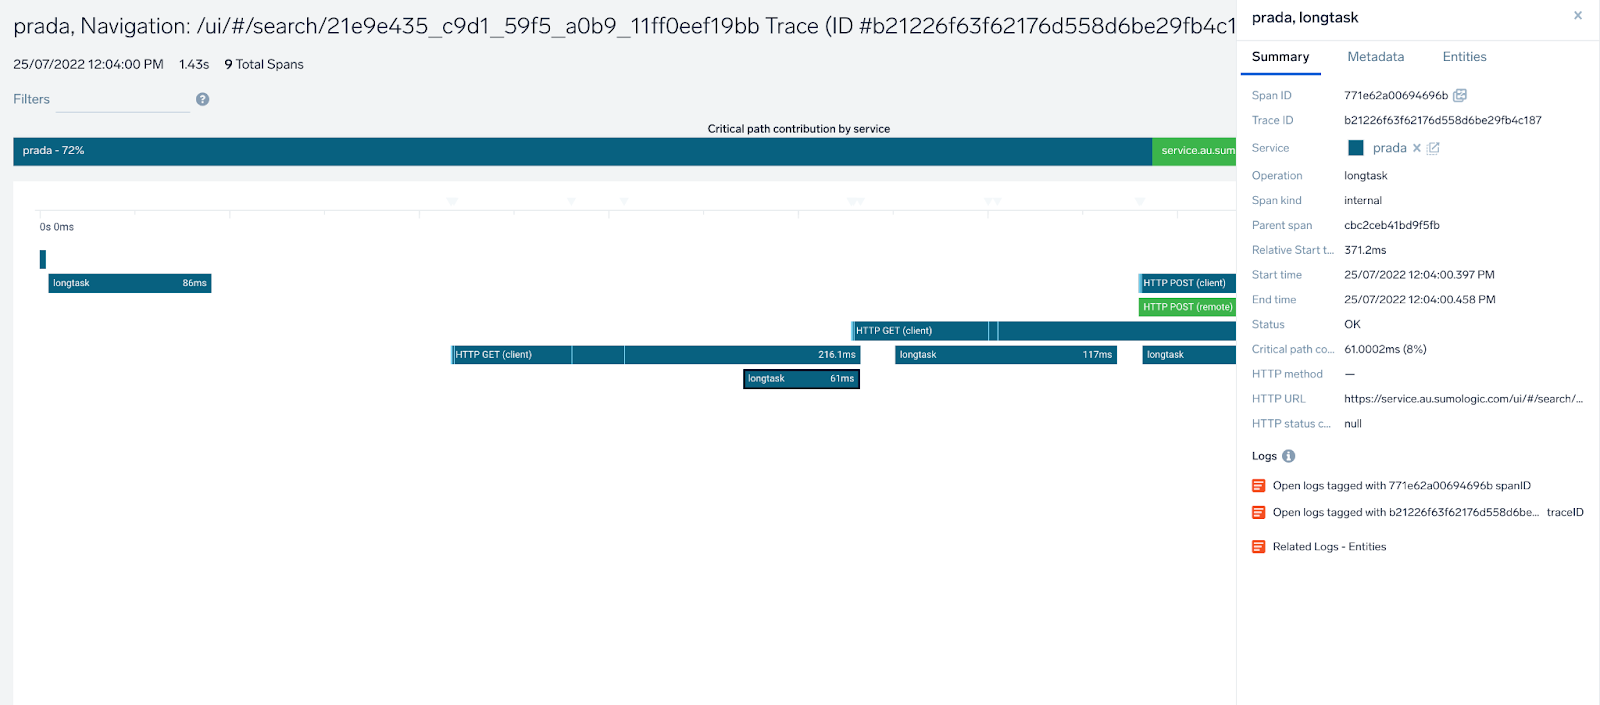
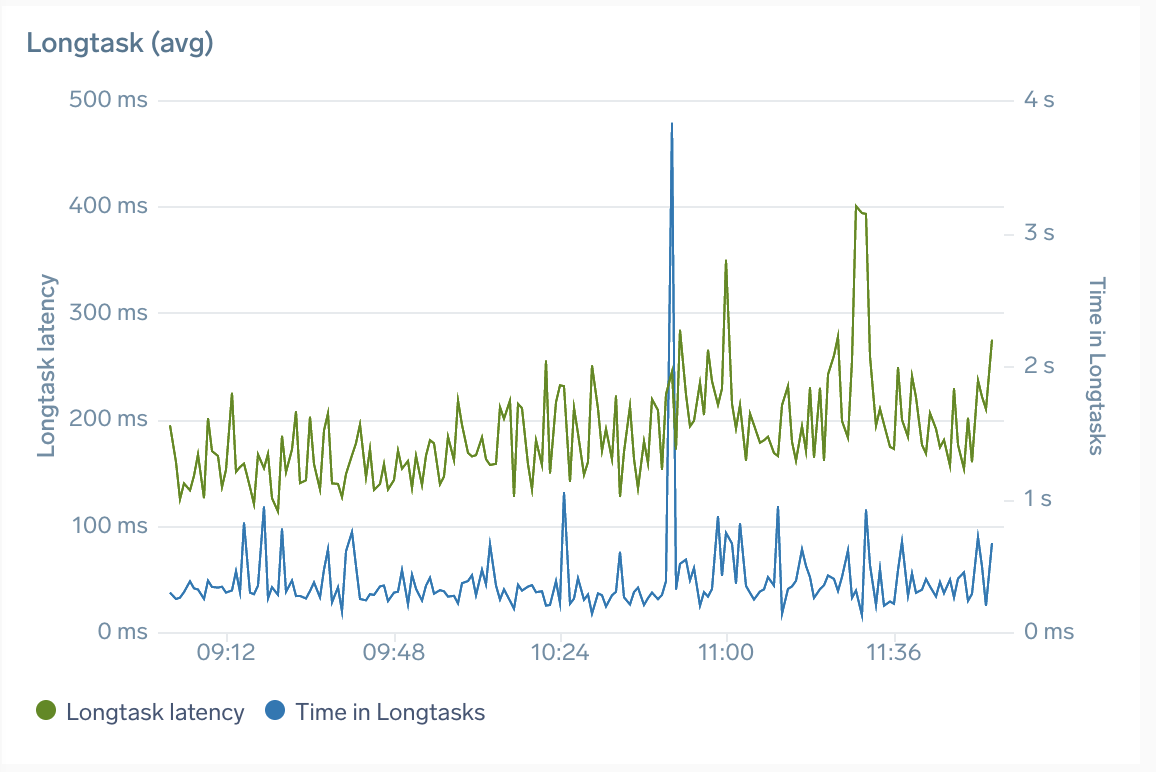
Longtasks indicate the main browser UI thread is locked for extended periods (greater than 50 milliseconds) and block other critical tasks (including user input) from being executed. If that happens for extended time, the user perceives this as a “freezed browser” that affects experience, even if the communication with the backend has completed a long time ago. RUM 2.0 automatically captures these events and:
Displays them as individual spans in individual traces, marking how long the browser was frozen
Longtask delay: average duration of longtask spans
Time in longtasks: total time spent in longtasks per user action/trace
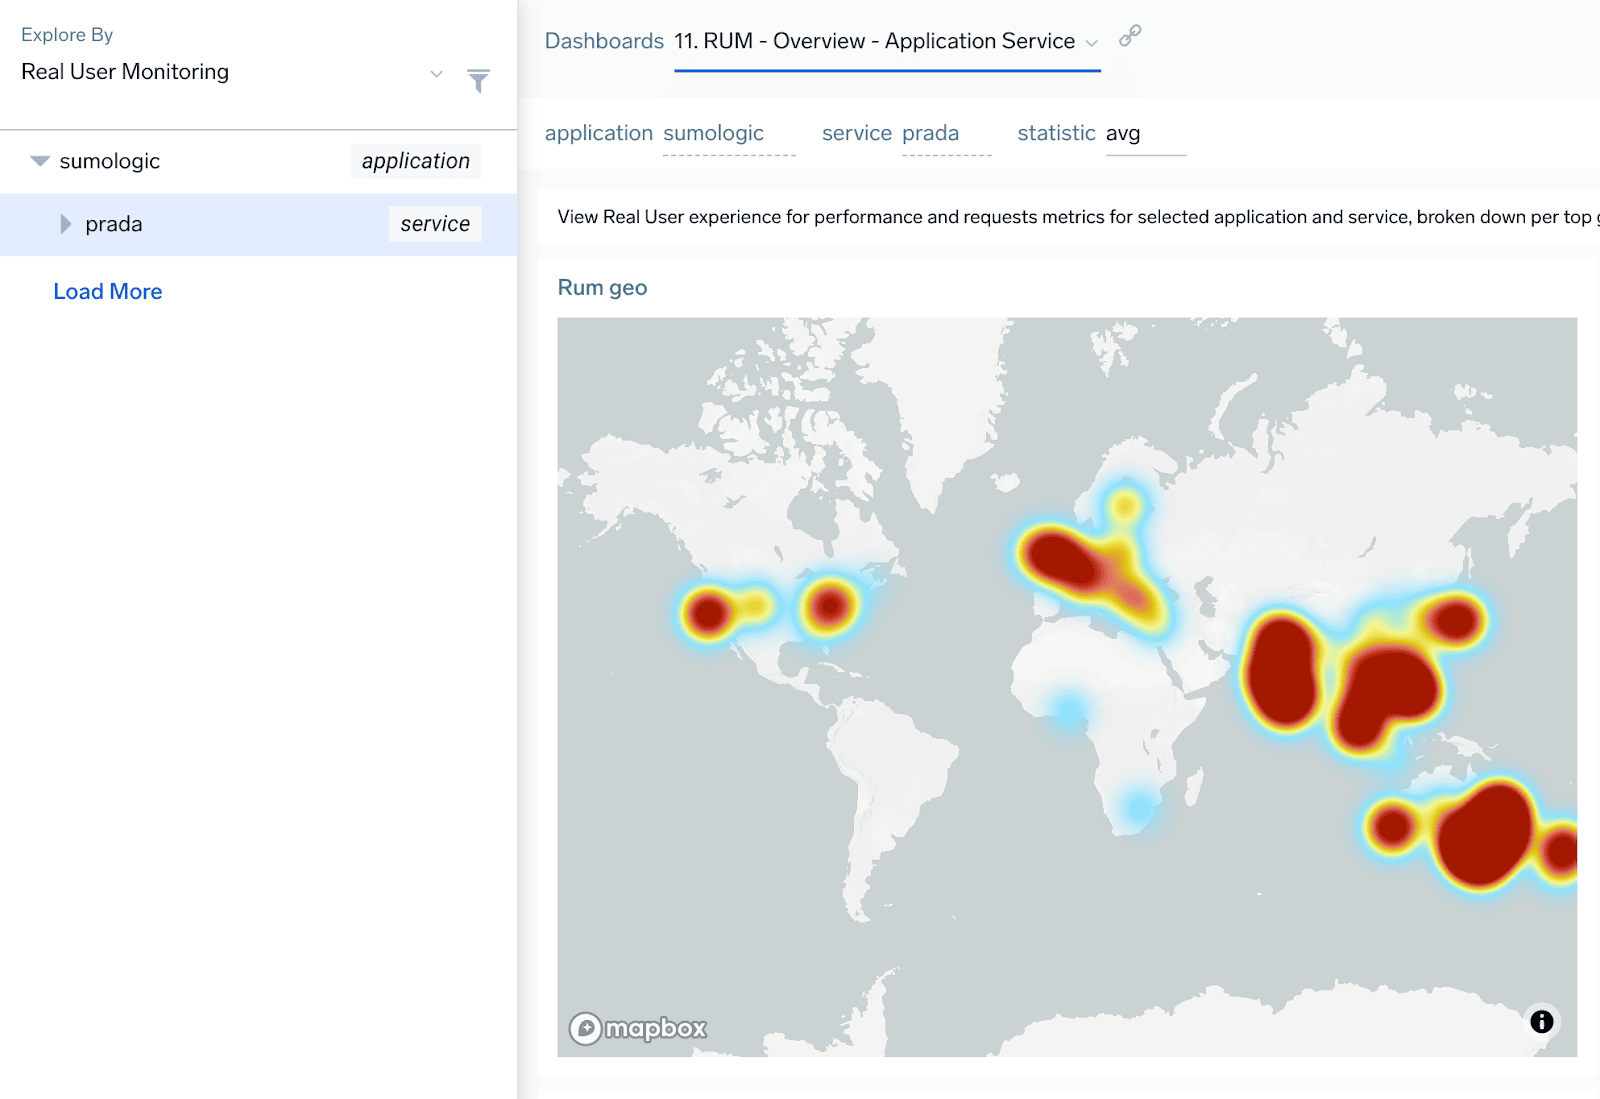
Overview dashboards on all explore levels now have a new log-based panel showing geographical user activity for a selected entity. Note this shows only activity, not performance, so red indicates more data, not worse performance.
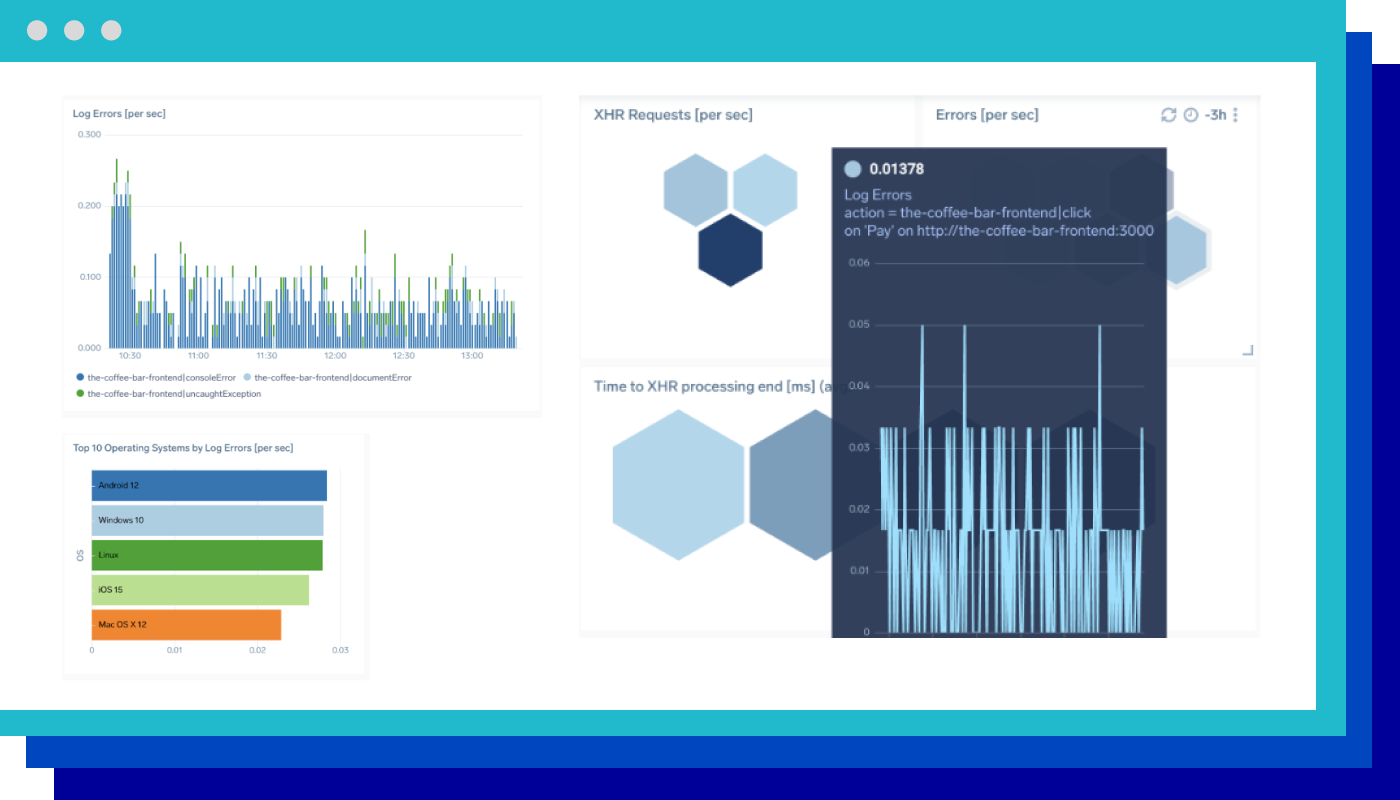
Sometimes browser UI fails and fails in an unhandled way, failing to deliver the transaction and breaking the user experience. That can happen in situations of unhandled errors or rejections or failed resources. Also, developers can design the page to write erroneous messages to the console.
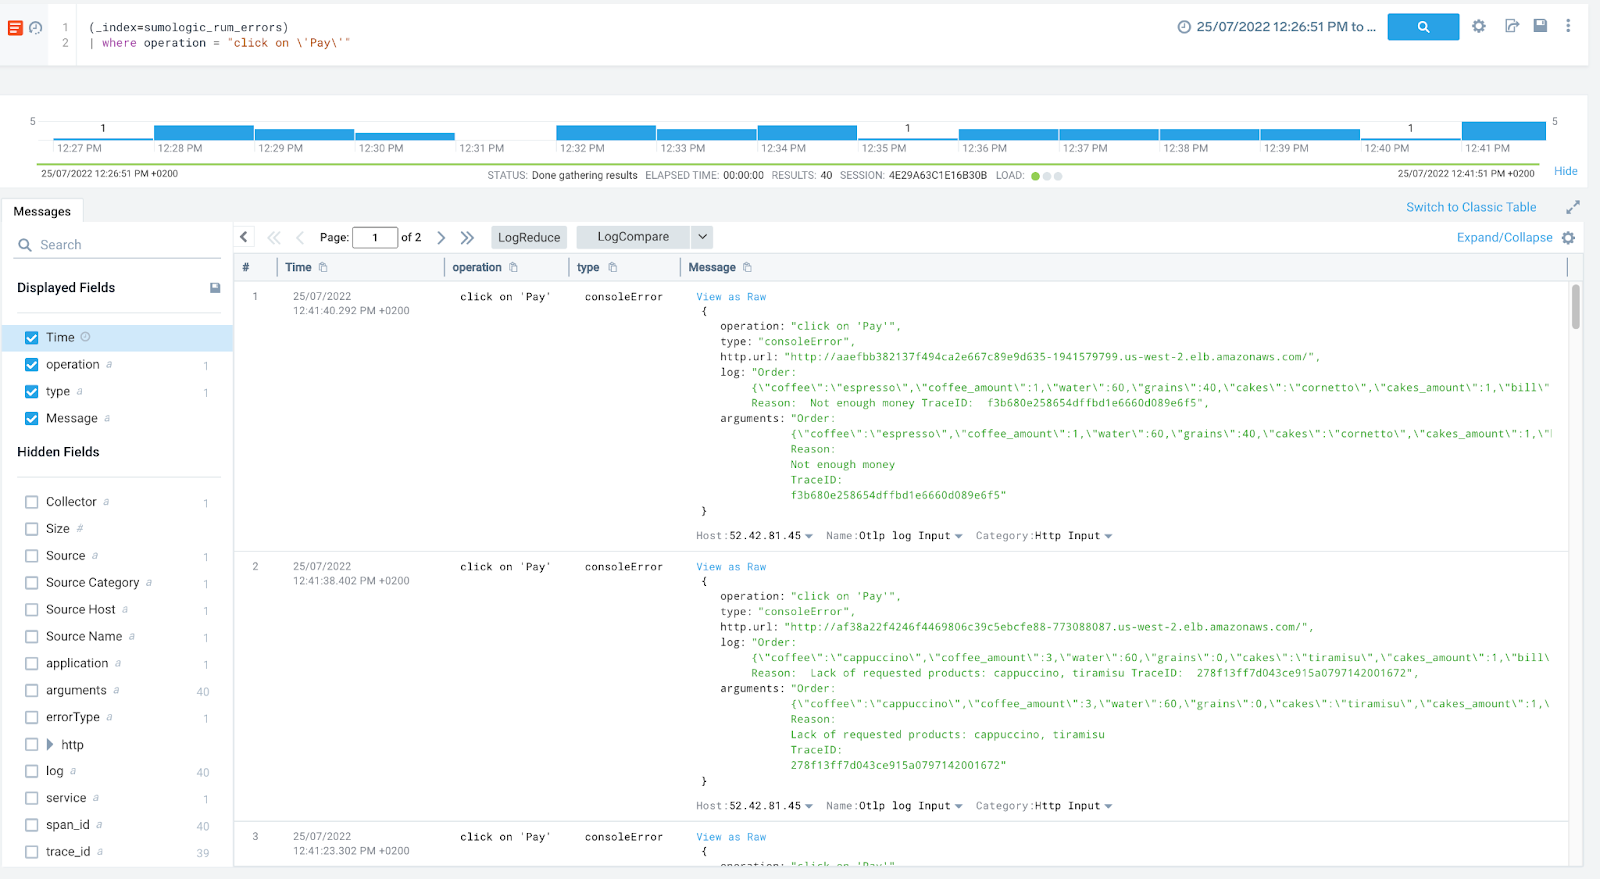
All these situations are captured by Sumo Logic browser instrumentation and forwarded to the same RUM source that is configured for trace data, which then forwards the log data to a continuous tier’s sumologic_rum_errors log index.
Data in the index is query-able using normal log search query. Here’s a sample query and results:
The following fields are available to better aggregate and filter the results:
Application
Service
Operation
Action name and type
Url
ErrorType
Geolocation data
User agent
Span and Trace ids
Note that errors don't always have to be connected with user actions, so it is ok to have some of these fields empty.
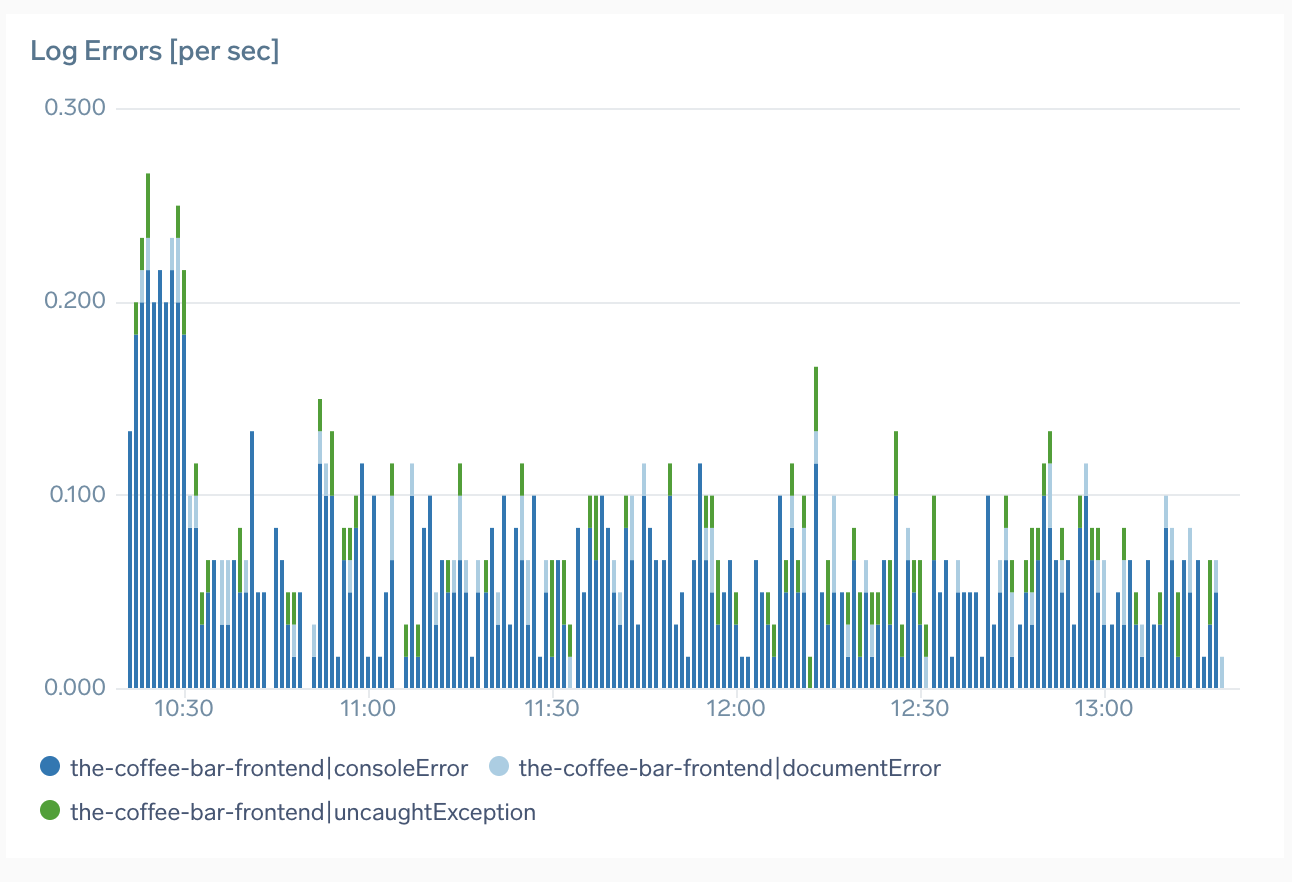
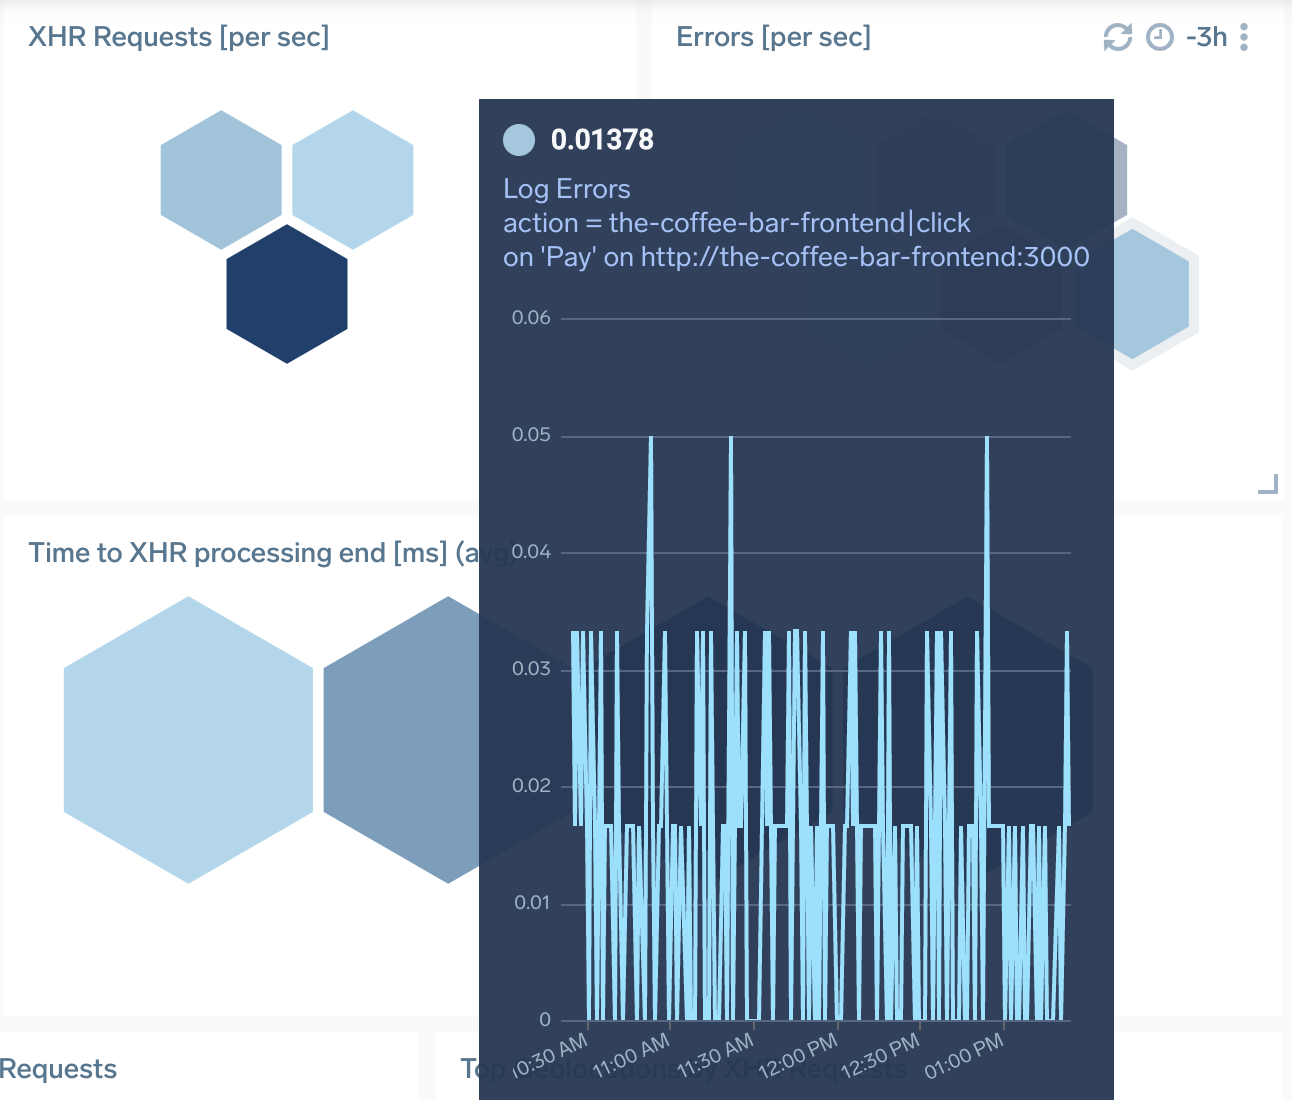
In addition to that we also aggregate that information in as log-query based panels and display on various dashboards:
Logs collection is enabled by default, you can disable by setting collectErrors=false in RUM script options.
This way, front end developers can have full visibility onto the flow and categories of errors generated by various parts of their browser application with contextual drill-down, free-form search and ability to build custom dashboards, which give them ability to shorten the troubleshooting time and pro-activeness in error tracing.
Hopefully these new additions will allow you to even better monitor your users performance and ensure a perfect digital experience for them that is a key for successful business growth with any modern market segment. If you are new to this and would like to try it, here’s a good starting point as well as more details on how to get started.
Reduce downtime and move from reactive to proactive monitoring.
Build, run, and secure modern applications and cloud infrastructures.
Start free trial
Group Product Manager
Besides sailing and horseback riding, Pawel was always passionate about great user experience. He spent many years working hands-on with the biggest IT organizations in the world, understanding their problems and challenges with digital transformation to help them exceed their customers expectations by building monitoring and observability products that win the market. Pawel joined Sumo in summer 2019 and is busy since then with extending our platform to cover APM/tracing use cases.
More posts by Pawel Brzoska.

No credit card required. Up and running in minutes.
More than 2,100 enterprises around the world rely on Sumo Logic to build, run, and secure their modern applications and cloud infrastructures.
