
2022 Gartner® Magic Quadrant™ SIEM
Get the report
MoreTrusted by thousands of customers globally.
Browse our library of ebooks, briefs, reports, case studies, webinars & more.
September 13, 2022
A reliable digital customer experience is critical to the success of digital-first businesses. Each minute of downtime can result in the loss of revenue, unsatisfied customers, and damage to reputation. However, as your uptime gets closer to 100%, it gets exponentially harder to improve and often comes at the cost of speed of innovation. A good balance between innovation (i.e., new feature releases) and maintaining an acceptable level of reliability is key to success in the digital world.
Sumo Logic recently launched reliability management as a foundational capability under our observability portfolio to help customers define, manage, monitor and track service reliability. Our reliability management supports all types of telemetry — logs, metrics, traces — and supports various configurations to enable different use cases.
This blog will look at service level objectives (SLOs) from a technical perspective. Even though high-level concepts remain the same, each organization has different requirements for reliability depending on its domain, product and the use cases of its customers. We will elaborate and get specific with an example.
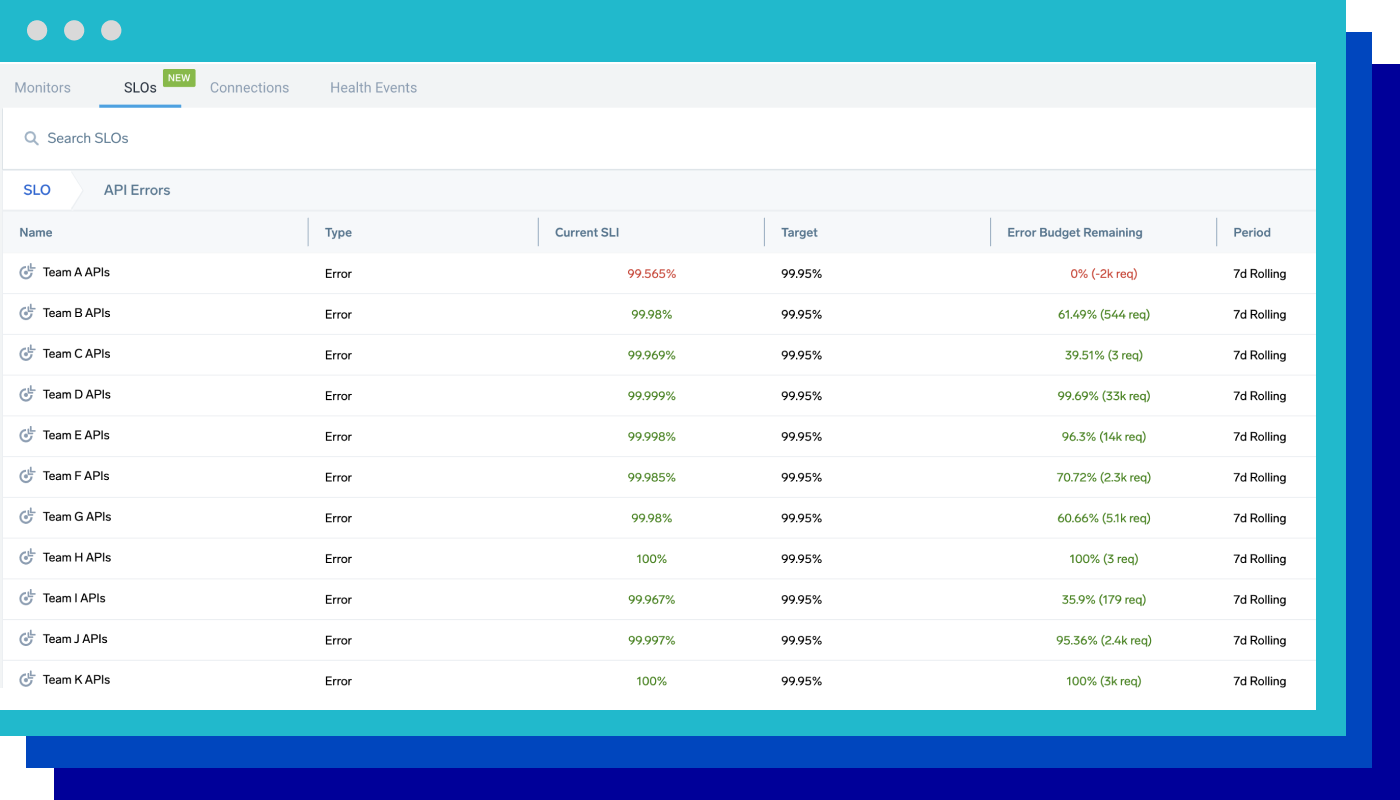
Let’s define an SLO using the Sumo Logic user interface (UI) and parse the different components involved in the SLO definition. Let’s say we want to define an SLO for API failures for a service. Go to the SLOs page:
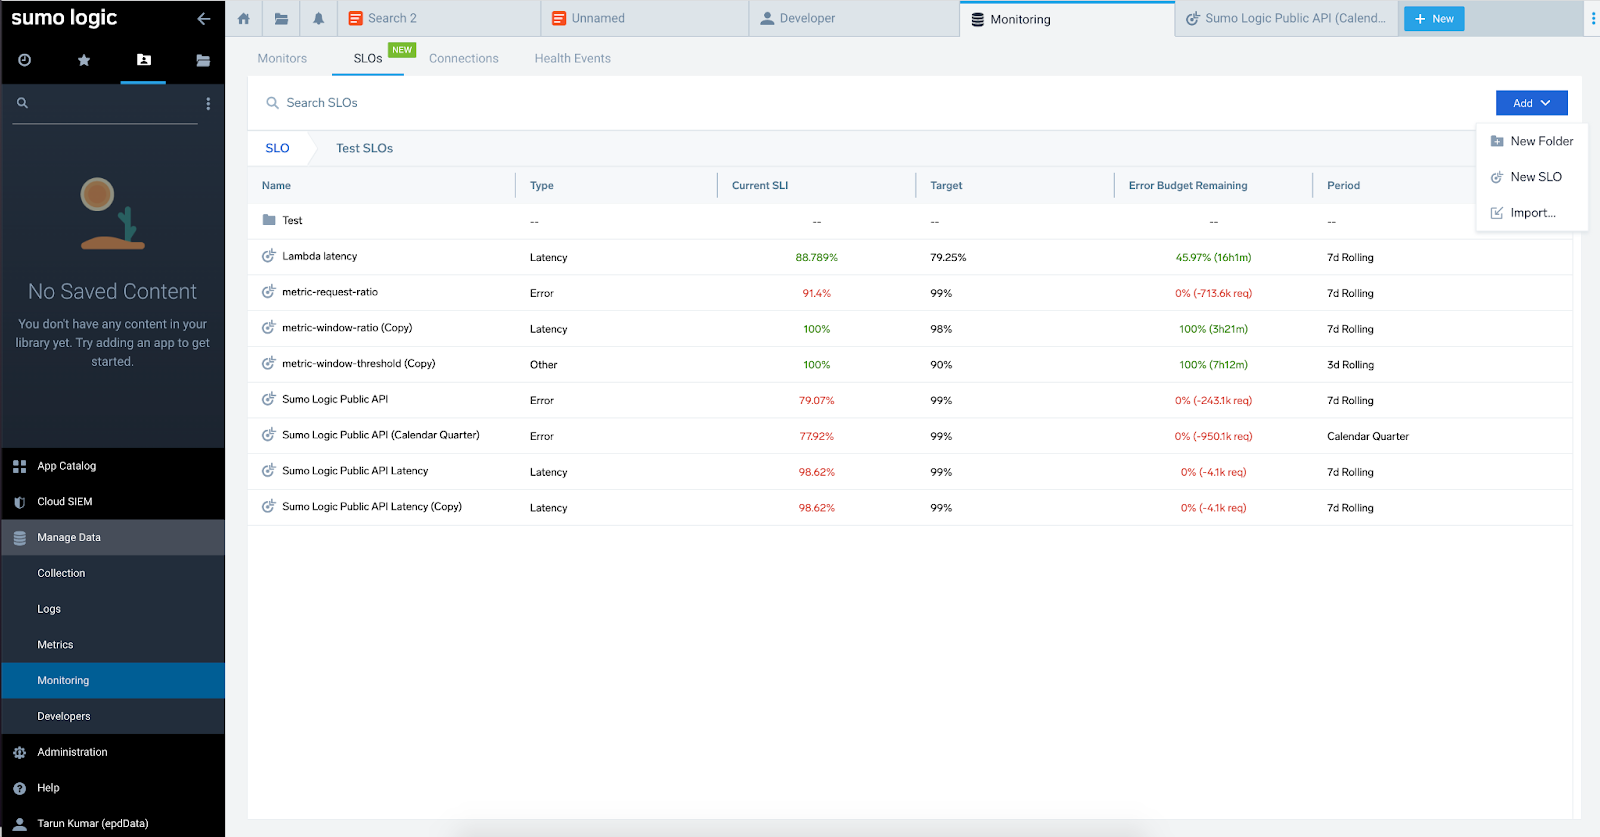
Click on Add -> New SLO. We will define our SLO in three simple steps:
(1) Service level indicator (SLI):
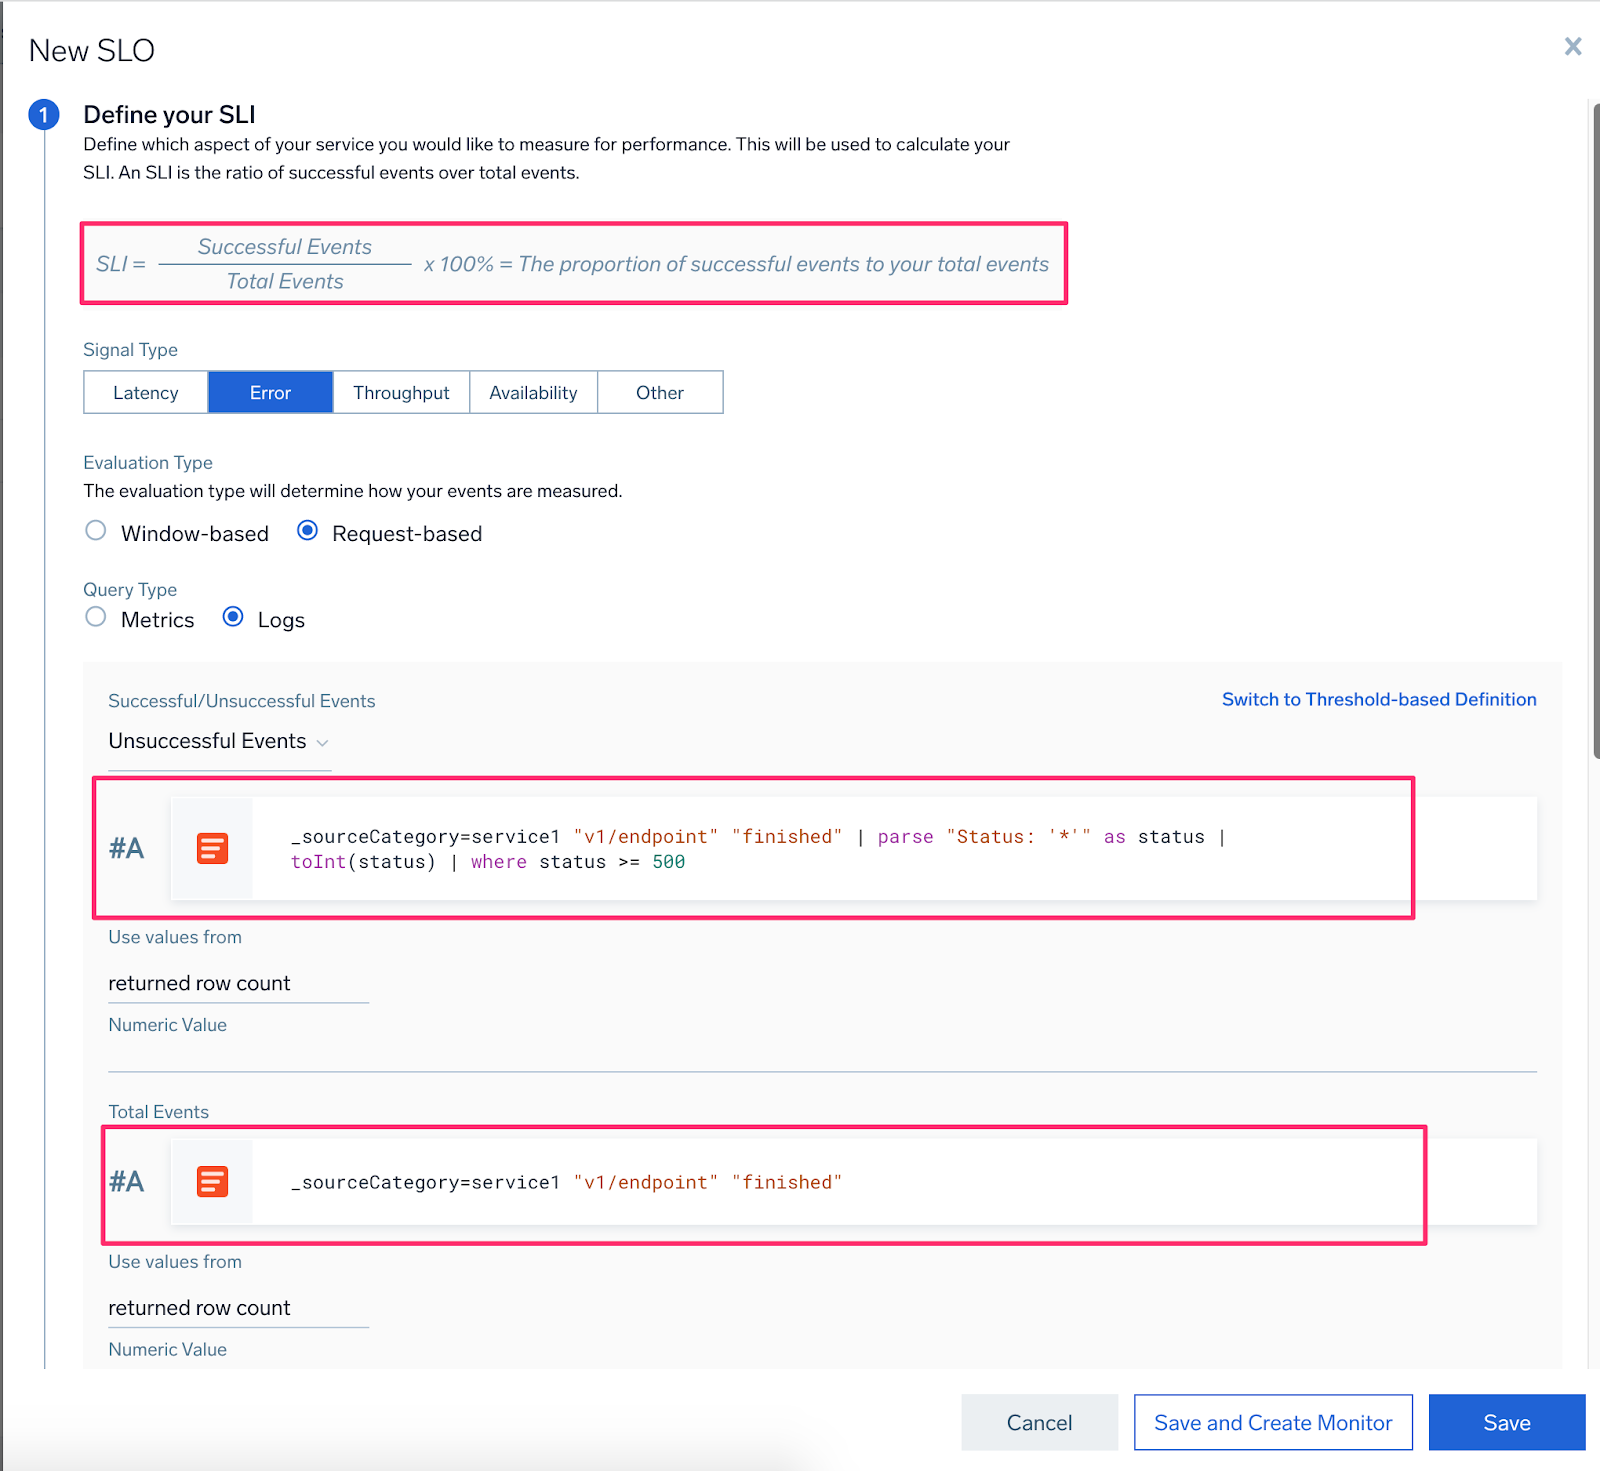
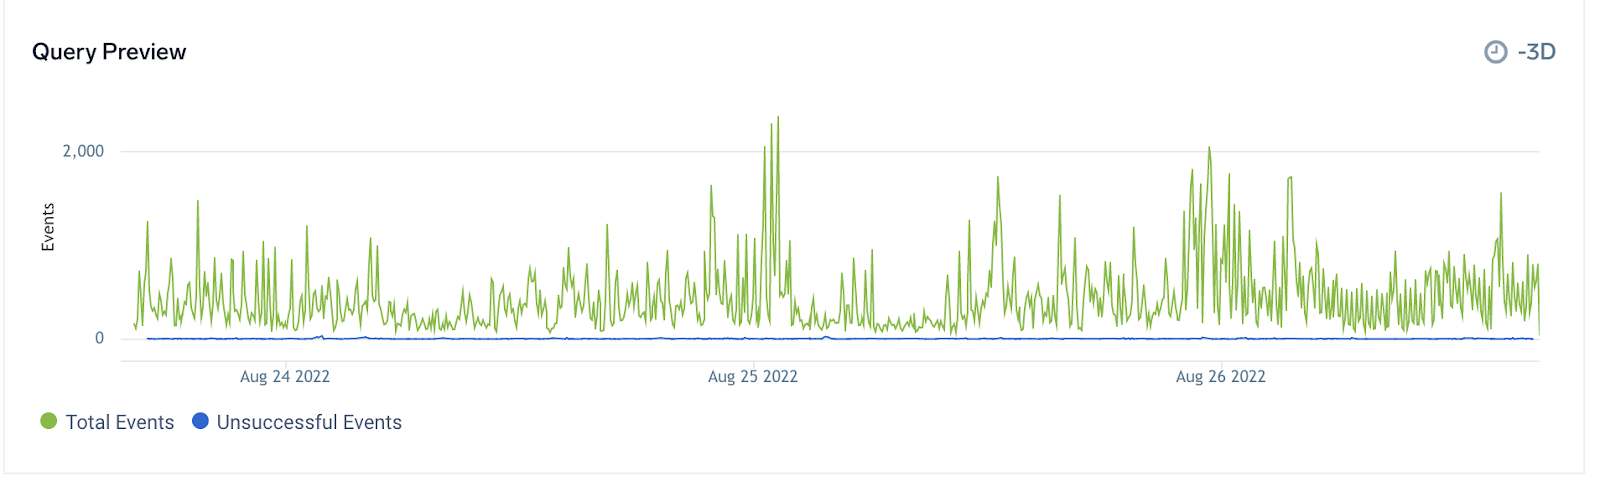
In this section, you specify how to measure the reliability of your service (Signal Type, Request vs Window-based Evaluation Type, Query Type - Logs vs Metrics, Queries, and thresholds for SLI). You’ll see the preview of your queries to help you configure the right query and choose the right thresholds:
In the following two sections, you configure your SLO threshold (2) and base attributes of the SLO (name and description) (3):
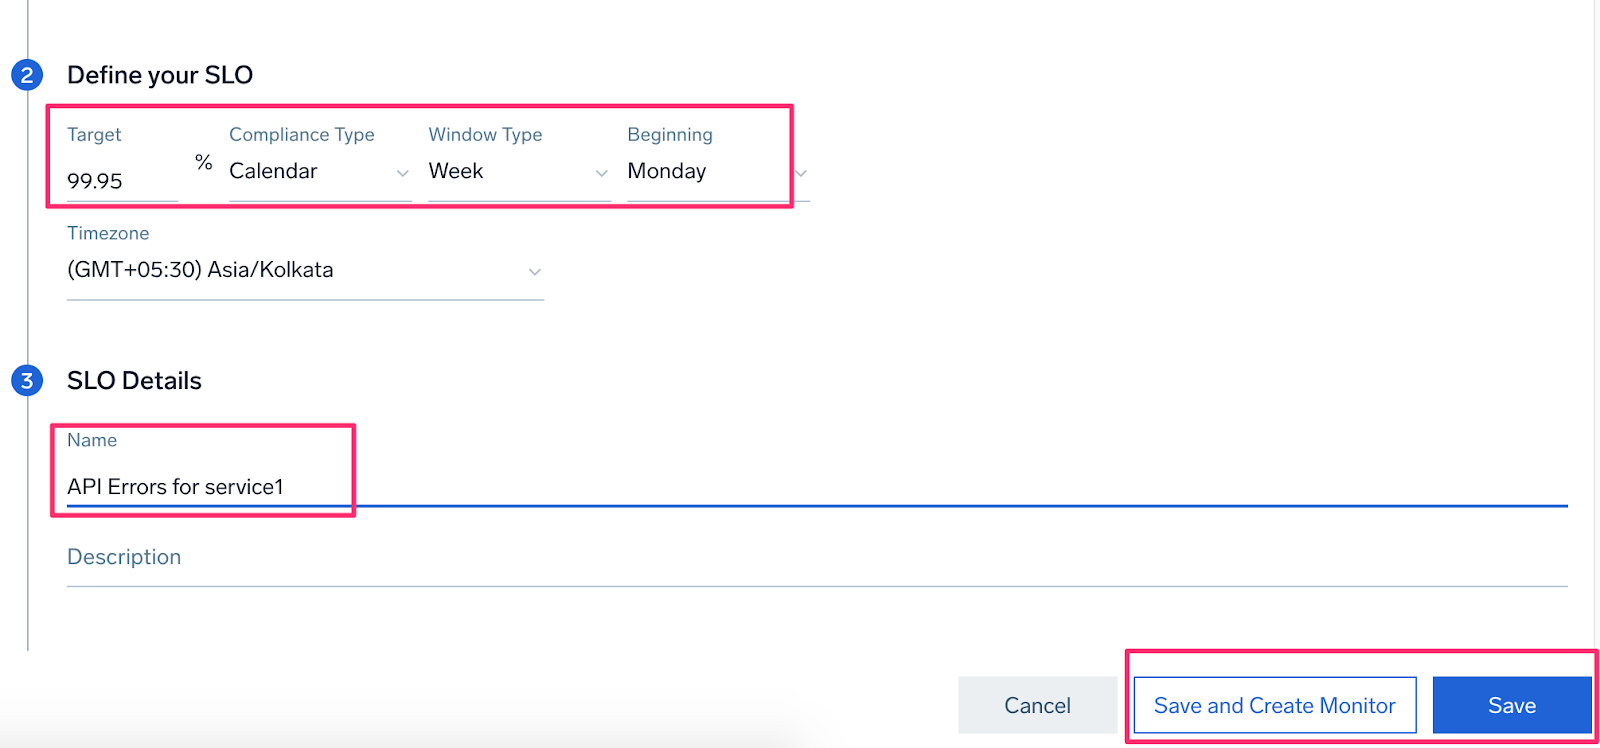
As a next step, either you can save your SLO or save and define a monitor on it. When the monitor threshold matches, it sends notifications on the notifications channel(s) specified in the monitor definition:
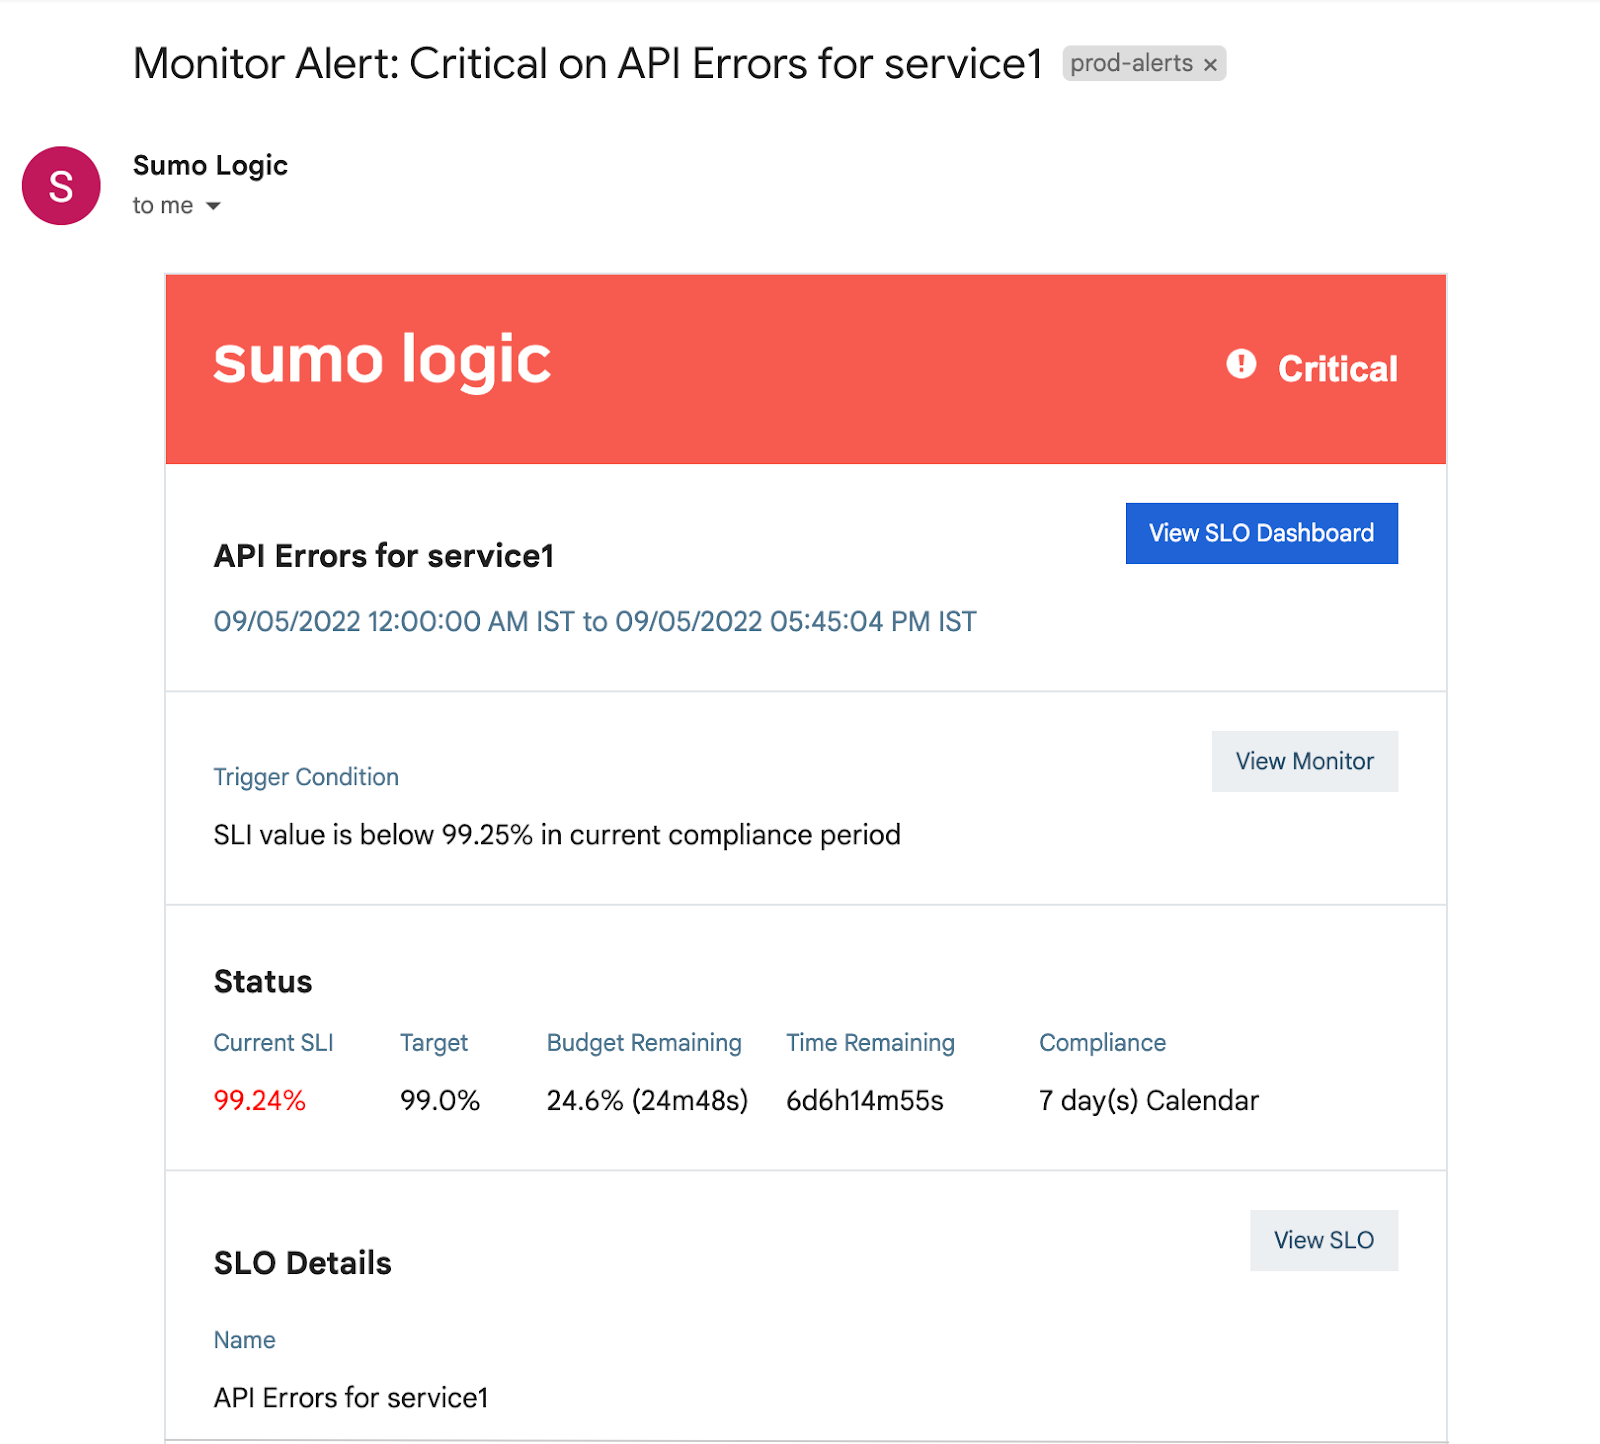
Then look at the current SLO state using the SLO dashboard. Use the “View SLO Dashboard” link (see the image above) or the “Open SLO Dashboard” button in the SLO details section (SLO right sidebar which opens when you click on an SLO in the list page).
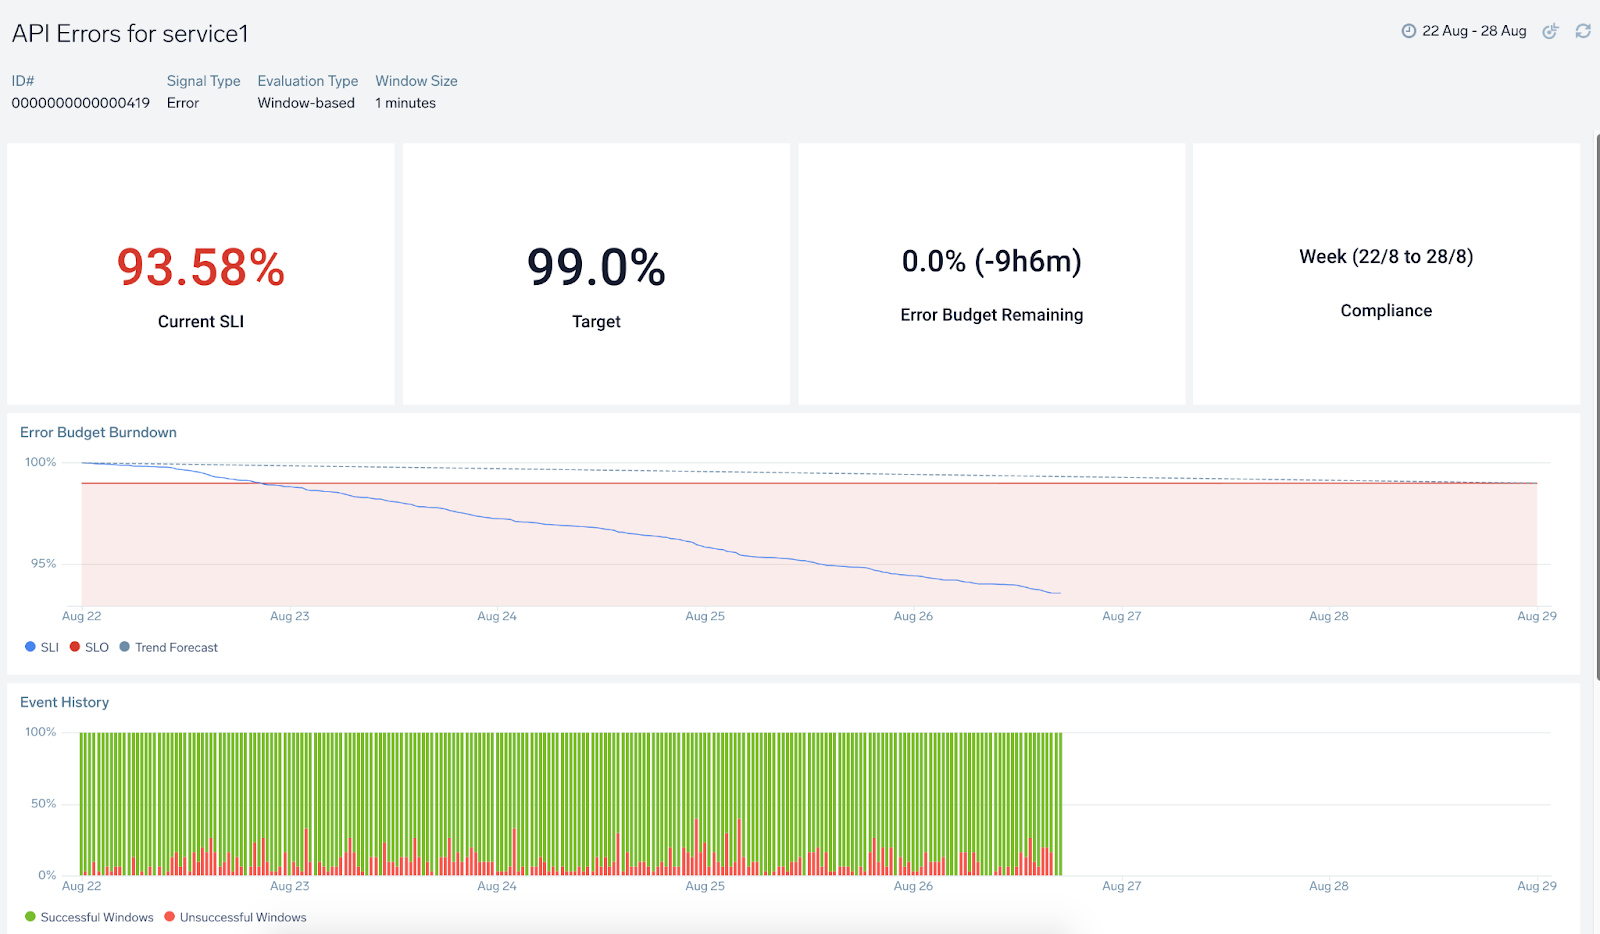
The SLO dashboard provides an active view of the health and status of the service based on your SLO configuration.
As we saw above, the SLO editor supports various types of configuration. This is how to approach each of those configurations.
Should I use request-based or window-based SLIs?
The number of operations (user actions via UI or API invocations) can vary throughout the compliance period. In request-based SLI, each request is considered equal, regardless of the time of day, day of the week, or month. The SLI value is the ratio of successful and total requests within a compliance period.
In window-based SLI, the compliance period divides into multiple small windows (user-configured) and each window is equal regardless of the number of operations within a window. Even if one window has 10x more requests compared to another one, both windows will have the same weight for the SLI. SLI value is the ratio of successful and total windows in this case.
Use a request-based SLI when:
Each request is considered equal in your service or application.
You track reliability based on the number of requests and not based on time.
Use a window-based SLI when:
You track reliability based on the time and not the number of requests.
If there is a huge spike in the number of unsuccessful requests for a brief period, you don’t want it to exhaust your error budget very quickly.
Should I use a ratio-based or threshold-based definition?
In the case of a ratio-based definition, the SLI is a ratio of successful and total requests. A ratio-based SLI is easy to define if you calculate successful/unsuccessful requests independently using two different queries.
In the case of a threshold-base definition, Sumo Logic calculates the SLI value using a single query. In the case of a window-based SLI, the field value is aggregated using an aggregation function (sum, min, max, avg, pct) and compared against the threshold. If the threshold matches, it is a successful window; if not, it is unsuccessful. In the case of request-based SLI, the field value is compared against the threshold. If the threshold matches, it is considered a successful request; if not, it is an unsuccessful request.
Use a ratio-based definition when:
The source of successful/unsuccessful requests is different from the total requests.
It is easier to define queries for successful/unsuccessful requests independently.
Use a threshold-based definition when:
The source of successful requests is the same as total requests.
Should I use a calendar or a rolling compliance type?
In the case of a calendar compliance type, the compliance period starts at the start of the day (00:00:00) of the calendar window. It ends at the end of the day of the calendar window (23:59:59). At any point, only one compliance period is active, e.g., in the case of weekly calendar compliance, if your week starts on Monday, the compliance period will span from 00:00:00 on Monday to 23:59:59 on Sunday.
In the case of a rolling compliance type, the compliance period starts at the start of the day (00:00:00) and ends at the end of the day of the compliance window (23:59:59) after n days if the compliance period is n days. On a given day, one compliance period will start, one compliance period will end, and there will be (n-2) compliance periods that will end in the future. If the compliance period is seven days, there will be seven active compliance periods at any point.
Let’s take an example. If today is 2022-08-15, active compliance periods will be:
2022-08-09 00:00:00 - 2022-08-15 23:59:59 - this compliance period ends today
2022-08-10 00:00:00 - 2022-08-16 23:59:59 - this compliance period ends tomorrow
2022-08-11 00:00:00 - 2022-08-17 23:59:59 - this compliance period ends in the future
2022-08-12 00:00:00 - 2022-08-18 23:59:59 - this compliance period ends in the future
2022-08-13 00:00:00 - 2022-08-19 23:59:59 - this compliance period ends in the future
2022-08-14 00:00:00 - 2022-08-20 23:59:59 - this compliance period ends in the future
2022-08-15 00:00:00 - 2022-08-21 23:59:59 - this compliance period starts today
Use a rolling compliance type when:
You don’t want the calendar-period change to reset the error budget and SLI.
You want to track SLI and error budgets for multiple compliance periods simultaneously.
Use a calendar compliance type when:
You want to track your SLOs over a calendar duration.
Each calendar duration (e.g., calendar month) is treated independently. One calendar duration doesn’t affect the error budget and SLI for other ones, even if it had big outages.
Should I define SLI or burn rate condition types in SLO monitors?
You will want to get notified before you run out of the error budget so that you can take corrective actions such as slowing down on new changes (e.g., new upgrades, enabling feature flags, etc.), making alerting more aggressive, etc. For example, if your target is 99% for a compliance period, you would want to be notified when you hit a 99.25% SLI value. In such a case, the “SLI” condition type makes sense.
If you are depleting your error budget too fast, you'll quickly run out of it. Even if you are at the start of the compliance period and have a significant error budget, you’ll want to stay ahead of the linear burn rate and respond quickly to have the error budget left for surprises later in the compliance period. Notifications based on the burn rate condition type will help you catch issues early on and react faster.
How do I build custom visualizations for my SLOs?
We publish SLO output data for every SLO to a view ('sumologic_slo_output') in your Sumo Logic account. You can query it using a log search (Sample search: _view=sumologic_slo_output sloId="<Your SLO ID>"), apply log search operators for further filtering and aggregation, and add this as a panel to a dashboard.
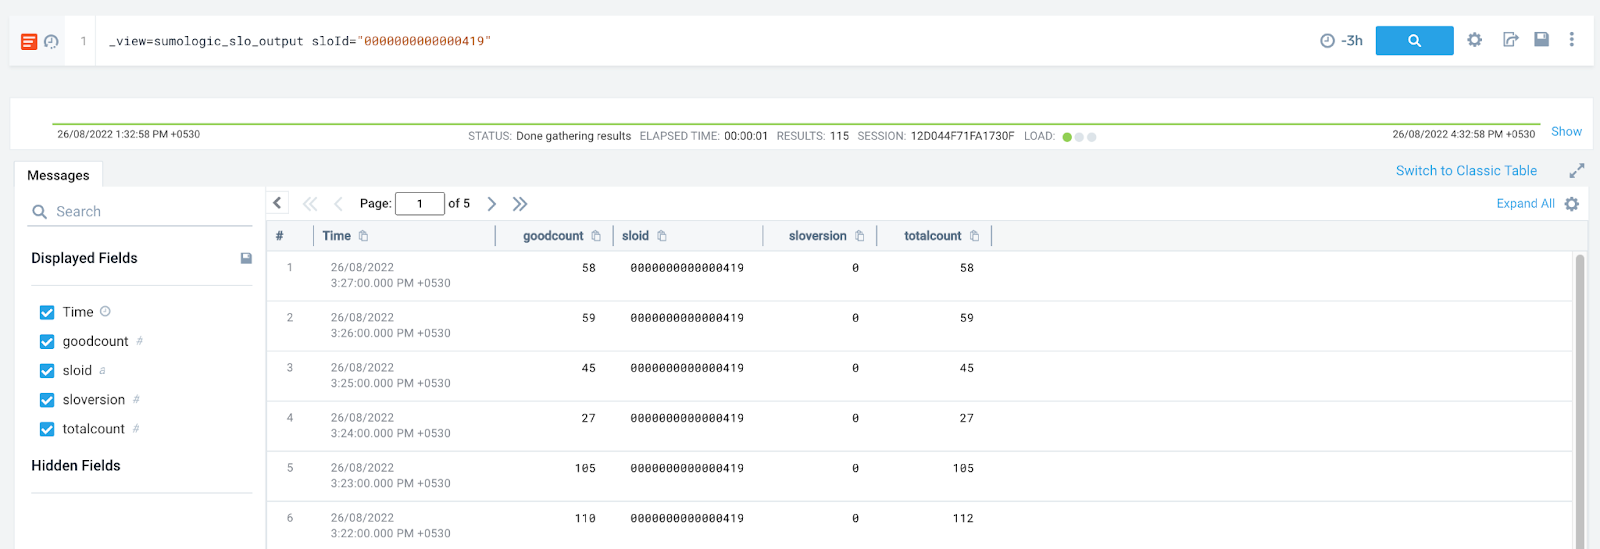
Sumo Logic publishes data at one-minute granularity to this view for each SLO. You can aggregate this data the way you like and use it anywhere in the product, including dashboards, monitors, and scheduled searches.
How should I configure my SLOs?
There are multiple ways to configure SLOs in Sumo Logic:
Sumo Logic UI: As described above
It uses OpenSLO specification to define SLOs. SLOs and SLOs monitors are defined using a vendor agnostic approach which enables no tight coupling with any vendor.
We are thrilled to announce the general availability of reliability management. Be sure to check our docs page for more helpful guides and background on our solution. If you’re looking for some best practices around reliability management before diving in, check out our ebook - A practical guide to reliability management.
Learn how to manage service level objectives (SLOs), service level indicators (SLIs), and error budgets with Sumo Logic.
Reduce downtime and move from reactive to proactive monitoring.
Build, run, and secure modern applications and cloud infrastructures.
Start free trial
No credit card required. Up and running in minutes.
More than 2,100 enterprises around the world rely on Sumo Logic to build, run, and secure their modern applications and cloud infrastructures.
