
2022 Gartner® Magic Quadrant™ SIEM
Get the report
MoreTrusted by thousands of customers globally.
Browse our library of ebooks, briefs, reports, case studies, webinars & more.
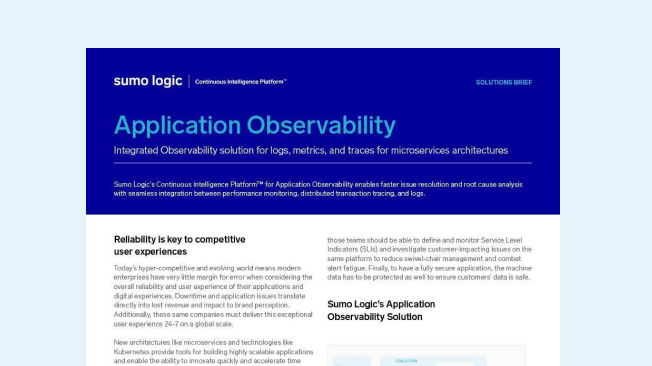
Reduce downtime and solve customer-impacting issues faster with an integrated observability platform for all of your application data including logs, metrics, and traces across the entire development lifecycle.
Sumo Logic’s Application Observability solution provides coverage across all of your data - performance metrics, logs and events, and distributed transaction tracing - on a highly scalable, secure, cost-effective analytics platform.
Customers can spend a large amount of time managing their tools instead of managing their applications.
Sumo Logic reduces monitoring setup time by proactively discovering new services and infrastructure as it is deployed. This information is then displayed in pre-configured dashboards and automatically configured alerts.
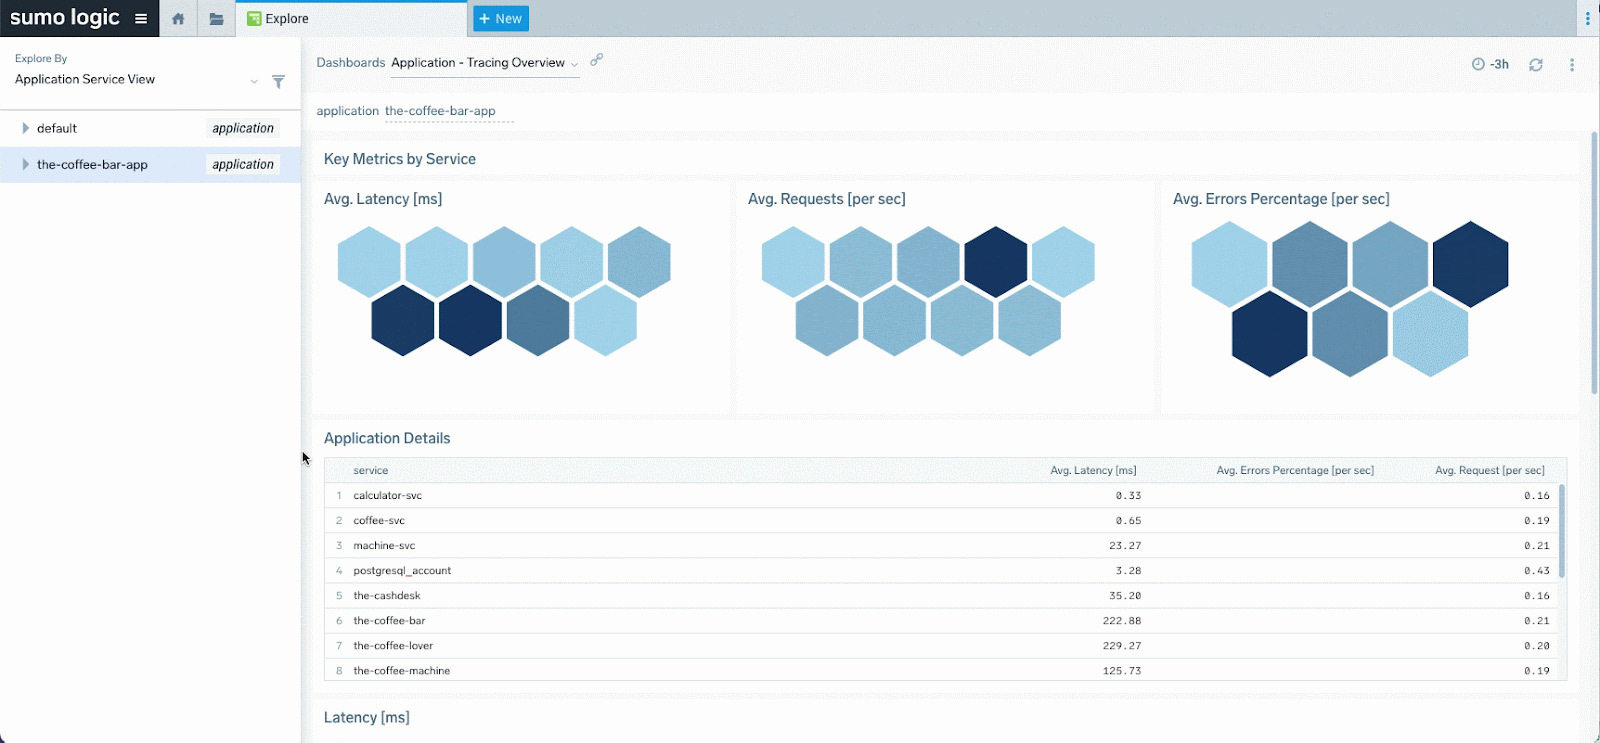
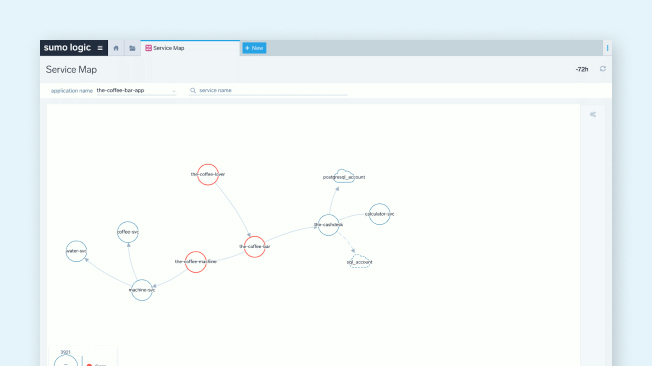
Diagnose application issues faster by visualizing the service dependencies and drilling down to the associated traces and infrastructure.
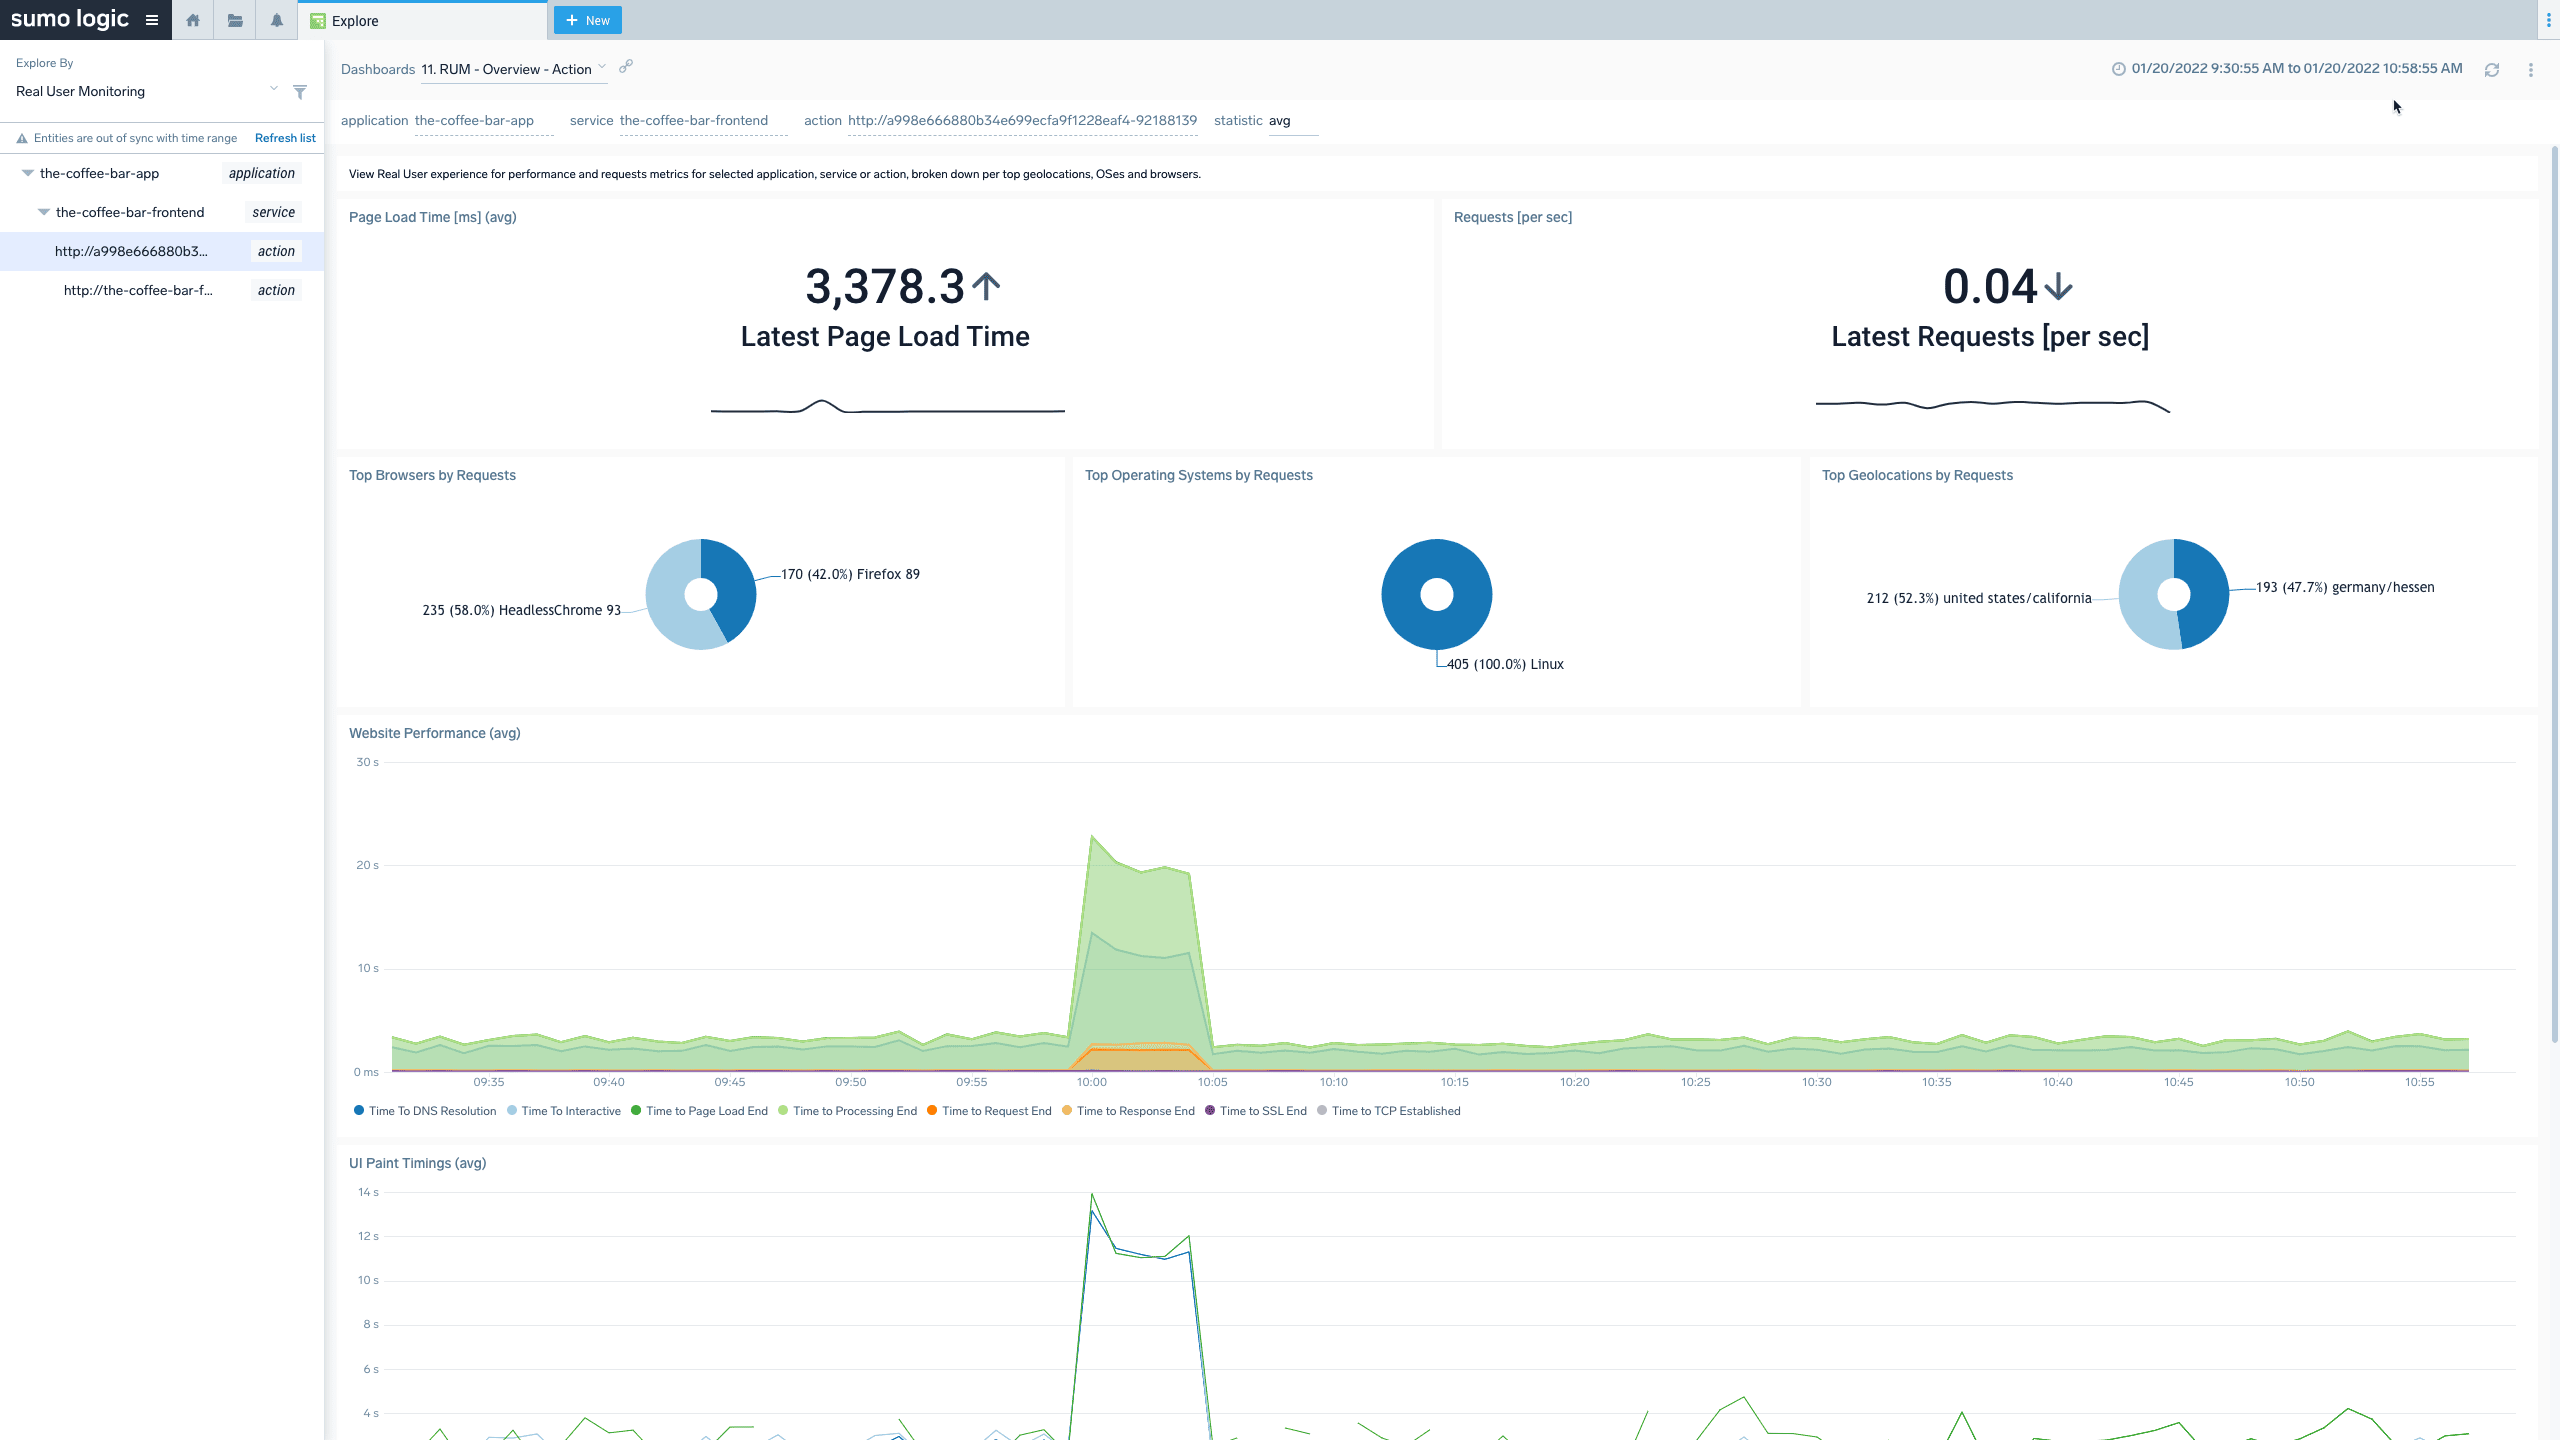
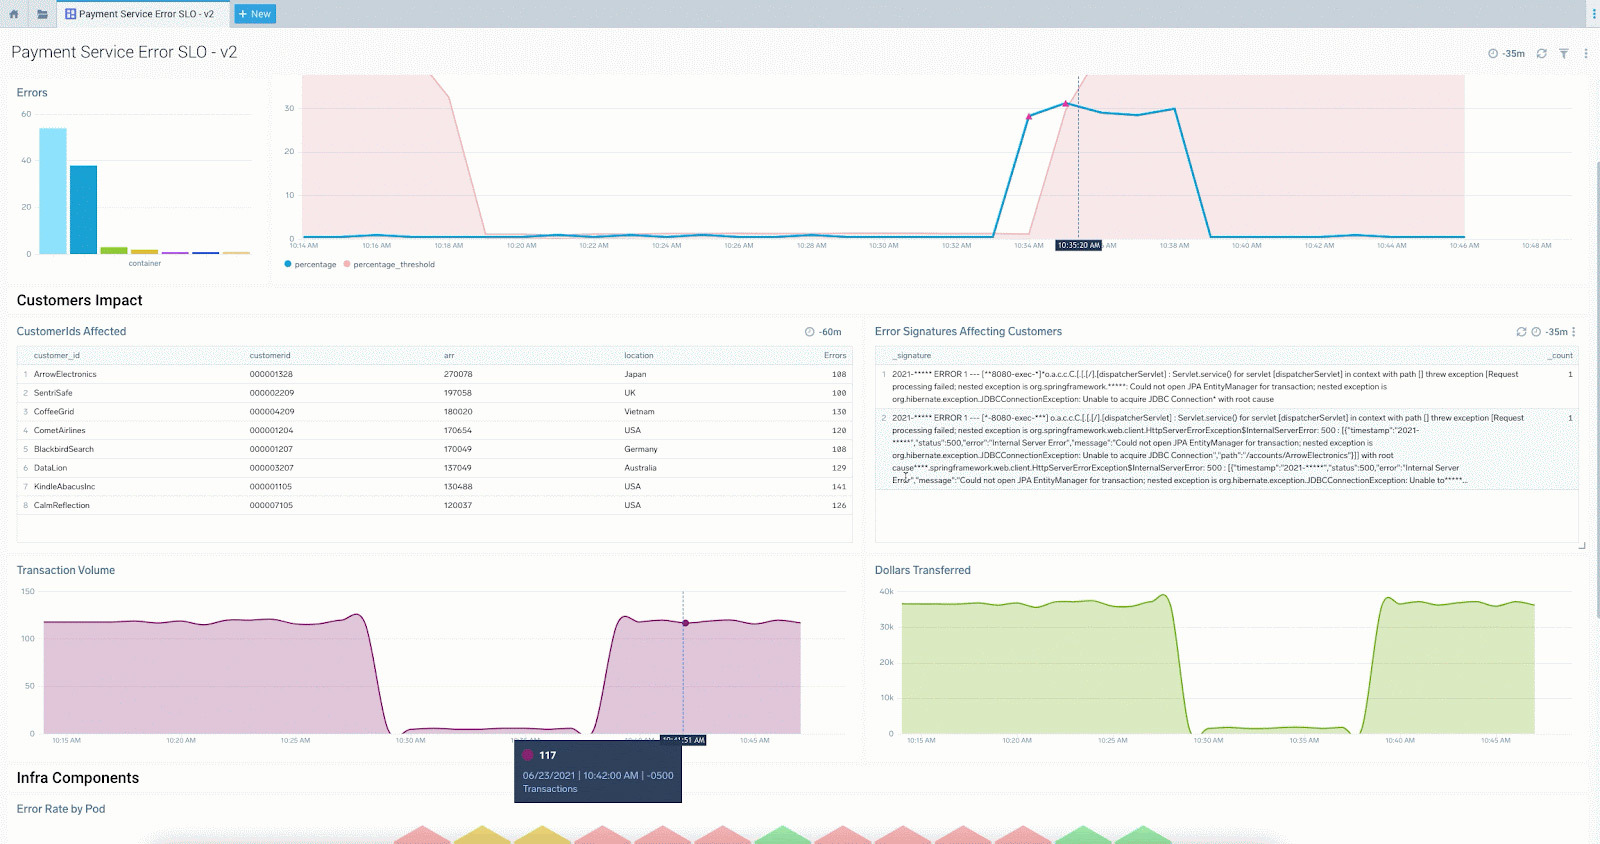
Real user monitoring tracks each click across the application and quickly surfaces poor performing pages.
Identify the root cause of application issues in seconds by leveraging ML powered Root Cause Explorer. Using correlated telemetry, quickly go from identifying components experiencing an anomaly to the root cause.
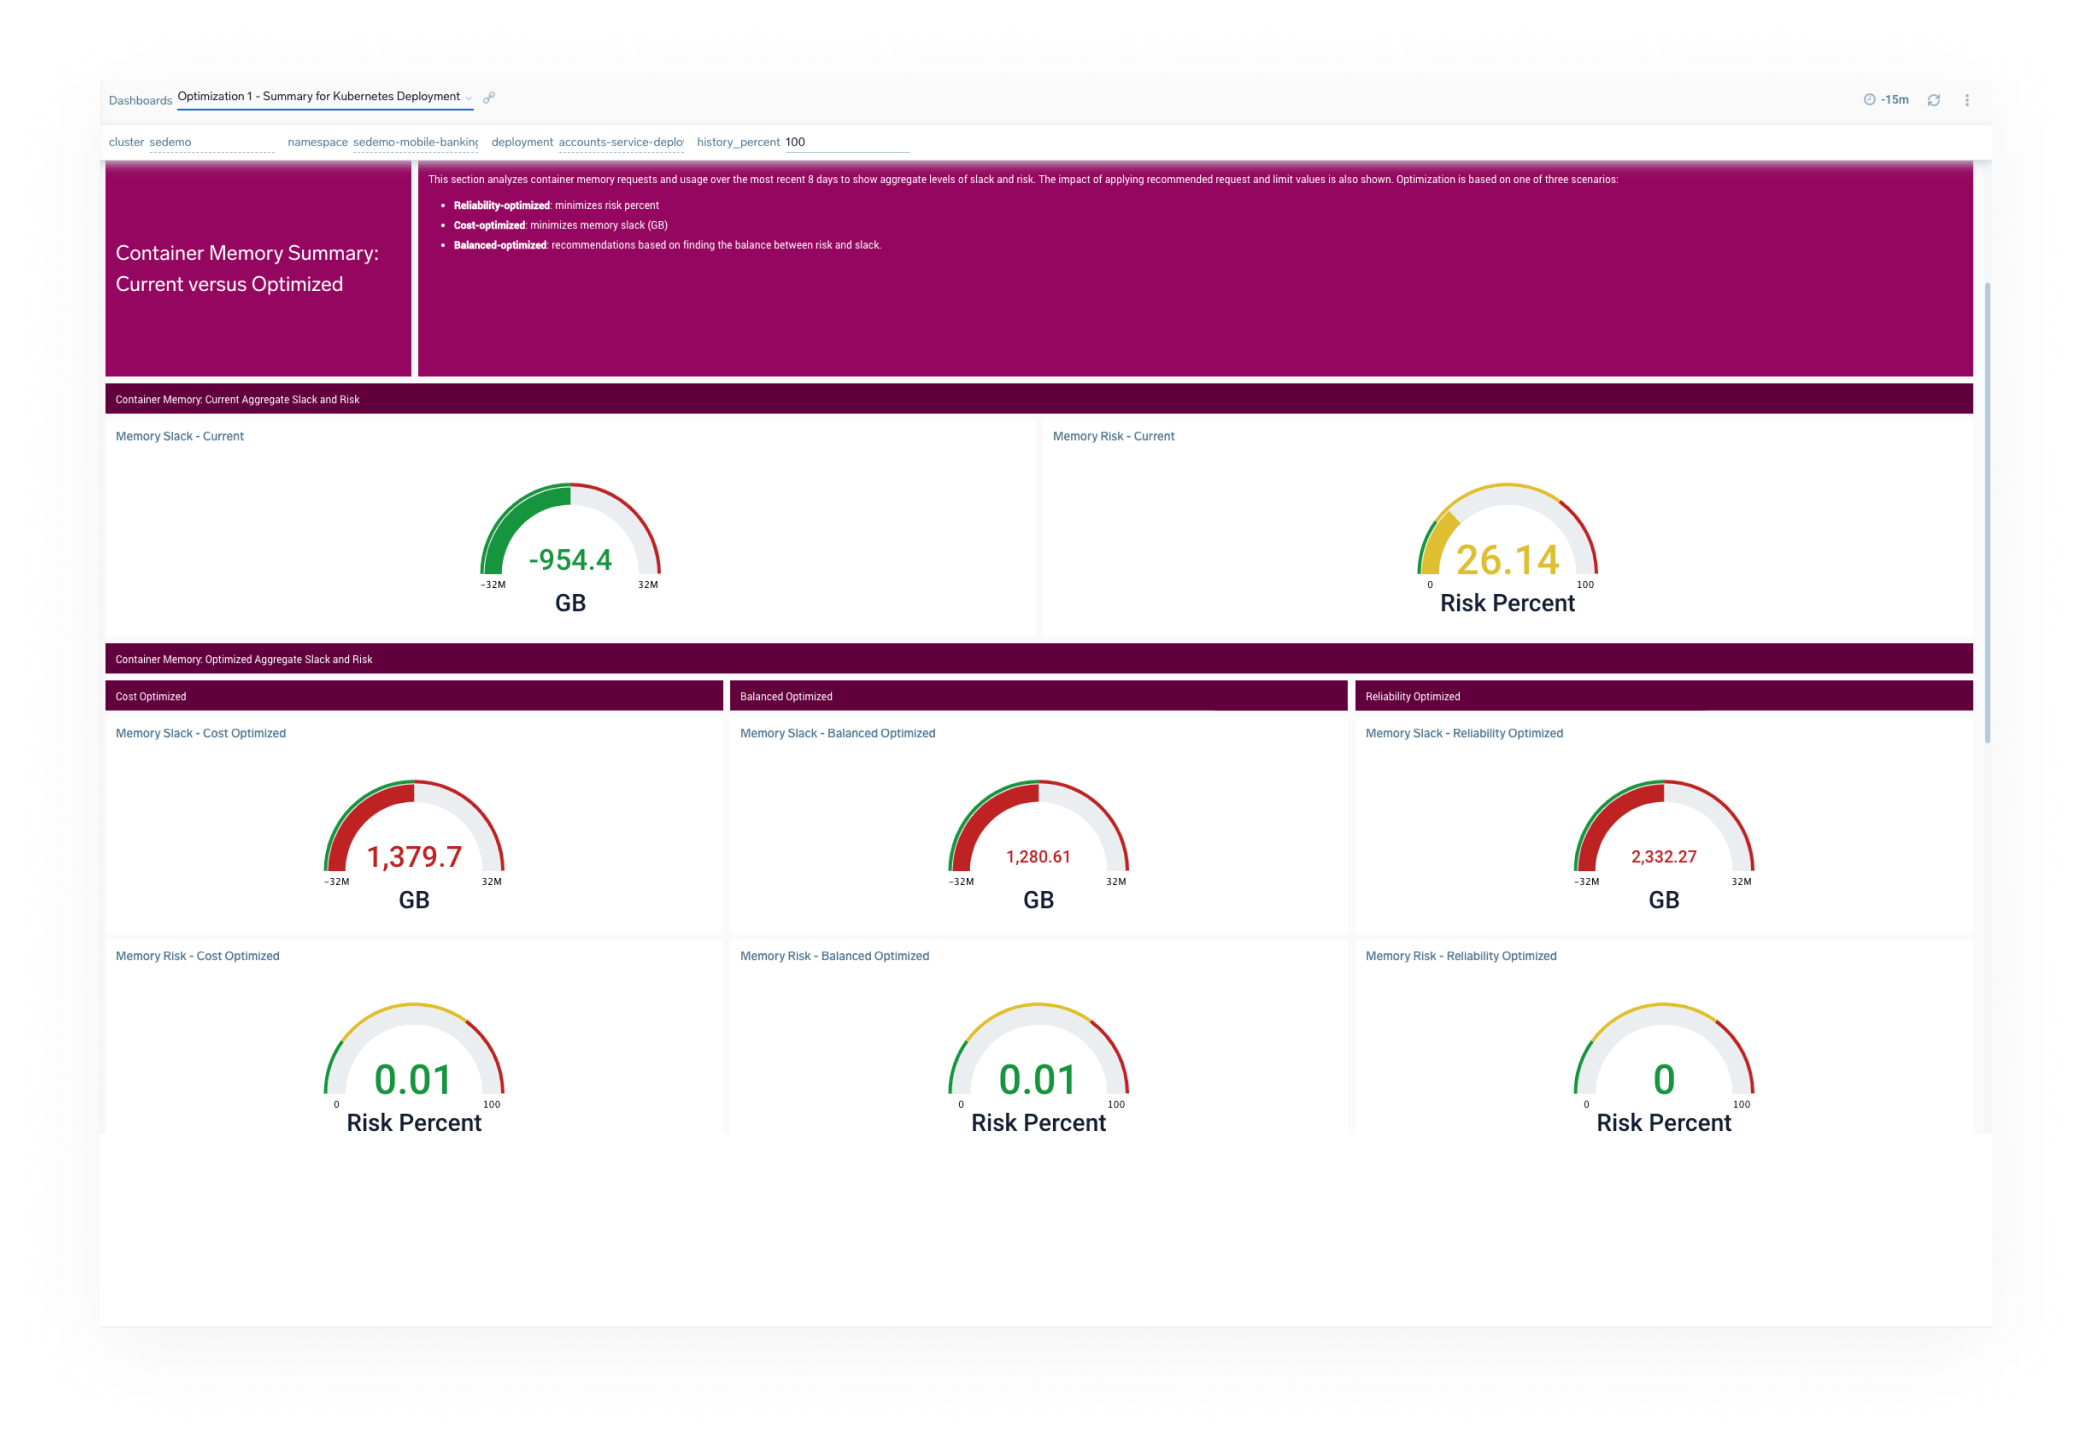
Optimize your applications and gain insight into usage patterns and best practices by leveraging golden-signal benchmarks of popular stacks like Apache, NGINX, and Kubernetes.
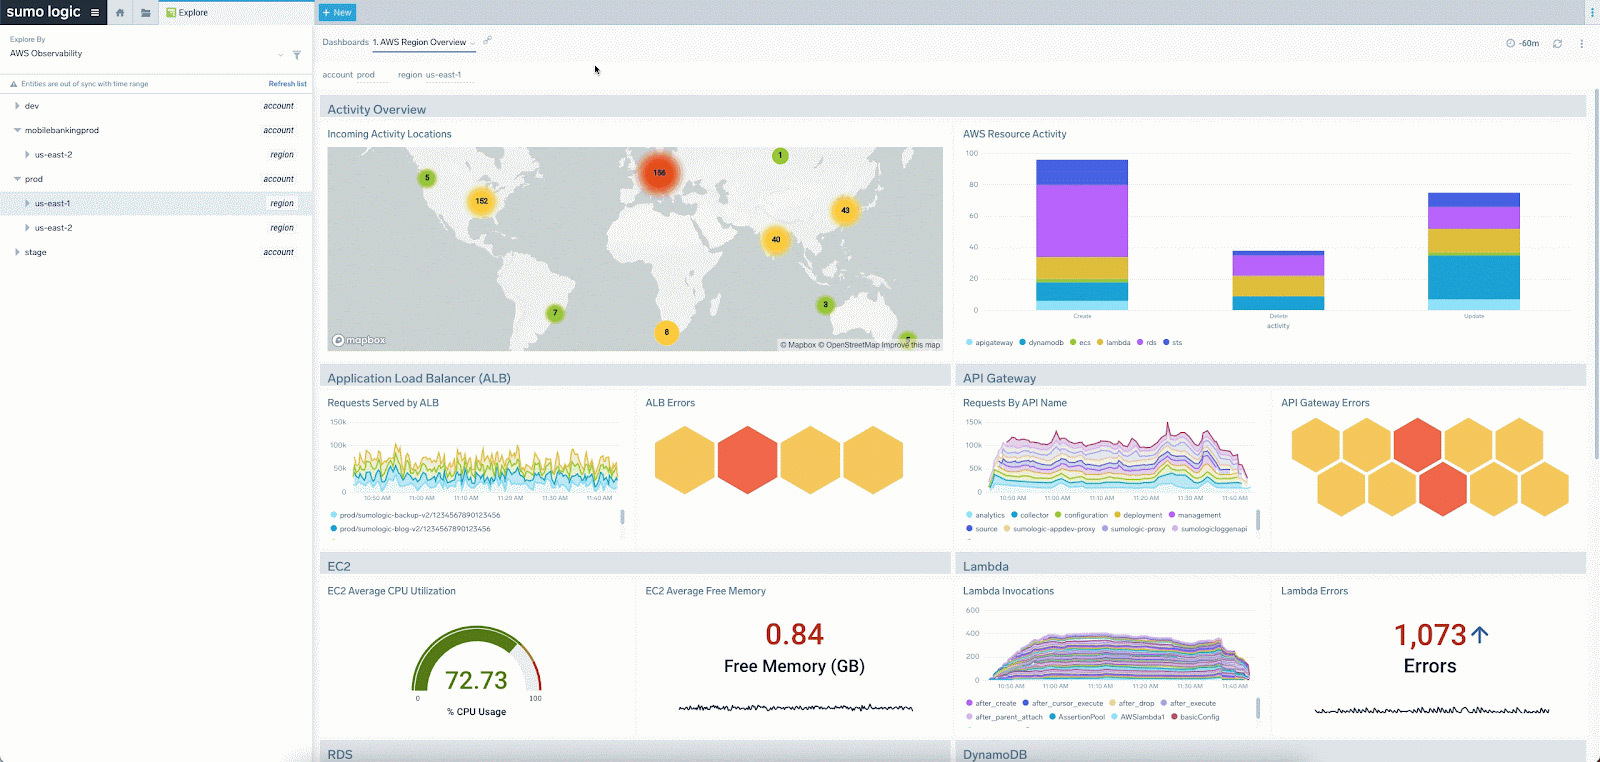
Navigate through the entire application stack and easily go from services to infrastructure powering them. Using an extensive catalog of preconfigured solutions, quickly add new components for complete visibility.
Application Observability measures application and infrastructure performance to manage the reliability of modern apps
Using a unified platform to ingest, analyse and correlate all application and infrastructure telemetry allows DevOps teams to quickly identify issues.
Rapidly pinpoint where application degradation is occurring and the services it’s impacting
Sift through all application telemetry in seconds with ML assisted capabilities to find the root cause of issues.
Leverage technology benchmarks to adjust application components to optimize their deployment.

Obtain full observability for your distributed applications

No credit card required. Up and running in minutes.
More than 2,100 enterprises around the world rely on Sumo Logic to build, run, and secure their modern applications and cloud infrastructures.
